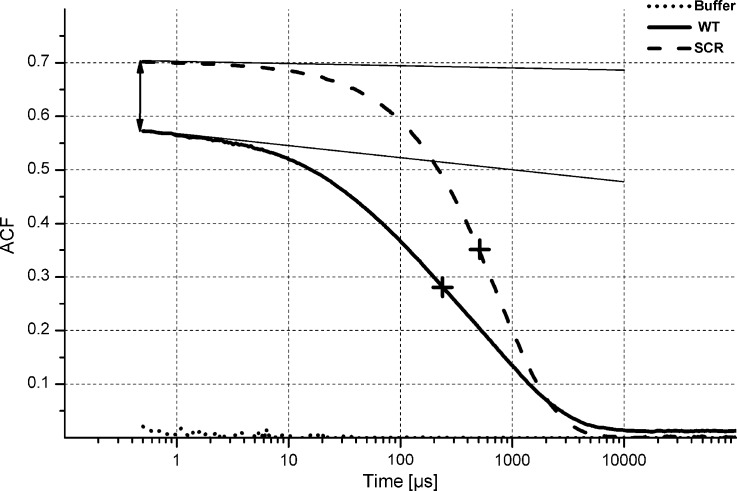
Fig 8. DLS experiment of WT Aβ 1–40 and SCR Aβ 1–40.
Representative autocorrelation function (ACF), directly adapted from dynamic light scattering data obtained for WT Aβ 1–40 (line) and SCR Aβ 1–40 (dashes). The autocorrelation function decays in the range of 1 down to 0, and the gap remaining to 1 observed at the shortest correlation time is indicative for the existence of monomeric or low-order oligomers, which remain undetectable. The short-correlation-time asymptote of ACF is marked by thin solid lines. The mid-point of an ACF decay is marked by the cross.

