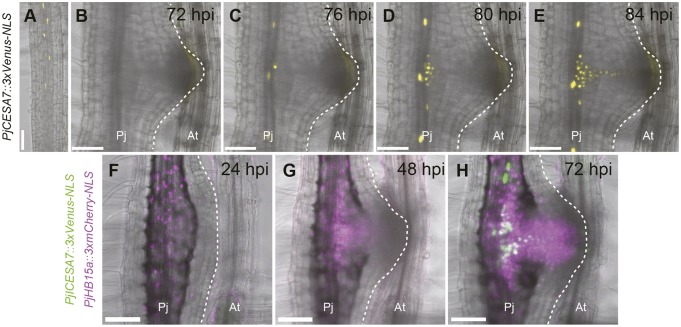
Fig. 4.
Expression dynamics of the xylem cell marker PjCESA7 during haustorium development. PjCESA7 expression dynamics in (A) root tip and during haustorium formation (B-E) at the indicated time points. Six Z-stack photos (43 μm thickness in total) were stacked using the maximum projection method. Venus fluorescence is in yellow. Bright-field and Venus fluorescent images are merged. Four out of five hairy roots showed a similar expression pattern. (F-H) Expression pattern of PjCESA7::3xVenus-NLS and PjHB15a::3xmCherry-NLS in the same haustorium at the indicated time points. Venus fluorescence is in green. mCherry fluorescence is in magenta. Bright-field, Venus fluorescent and mCherry fluorescent images are merged. The broken white lines mark the edge of the haustorium. Two out of two hairy roots showed a similar expression pattern. The same haustoria are shown in each time-course observation in B-E and F-H. Scale bars: 100 μm. Pj, Phtheirospermum japonicum root; At, Arabidopsis thaliana root.

