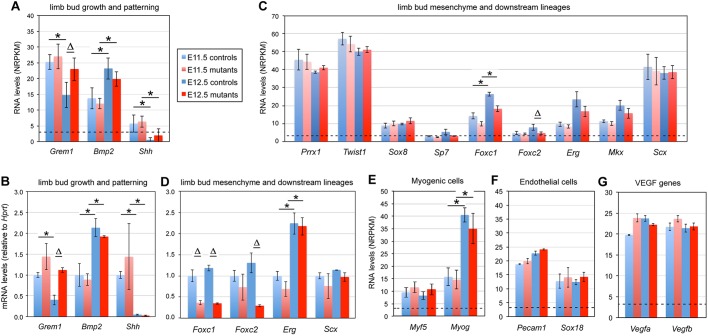
Fig. 3.
Impact of SOX9 on osteochondroprogenitor and non-chondrogenic cell markers in limb buds. Bar graphs show the RNA levels determined using RNA-seq (A,C,E-G) or qRT-PCR (B,D) for various genes in limb buds from control embryos (blue bars) and Sox9 mutant littermates (red bars) at E11.5 (light shades) or E12.5 (dark shades). Each panel features gene markers for specific processes or cell types, as indicated. Each bar is the mean±s.d. for three or four biological replicates. Dotted lines for RNA-seq assays indicate the threshold value for significant expression (NRPKM=3). ΔP<0.05 for differences between controls and mutants; *P<0.05 for differences between E11.5 and E12.5 (Student's t-tests).

