Fig. 5.
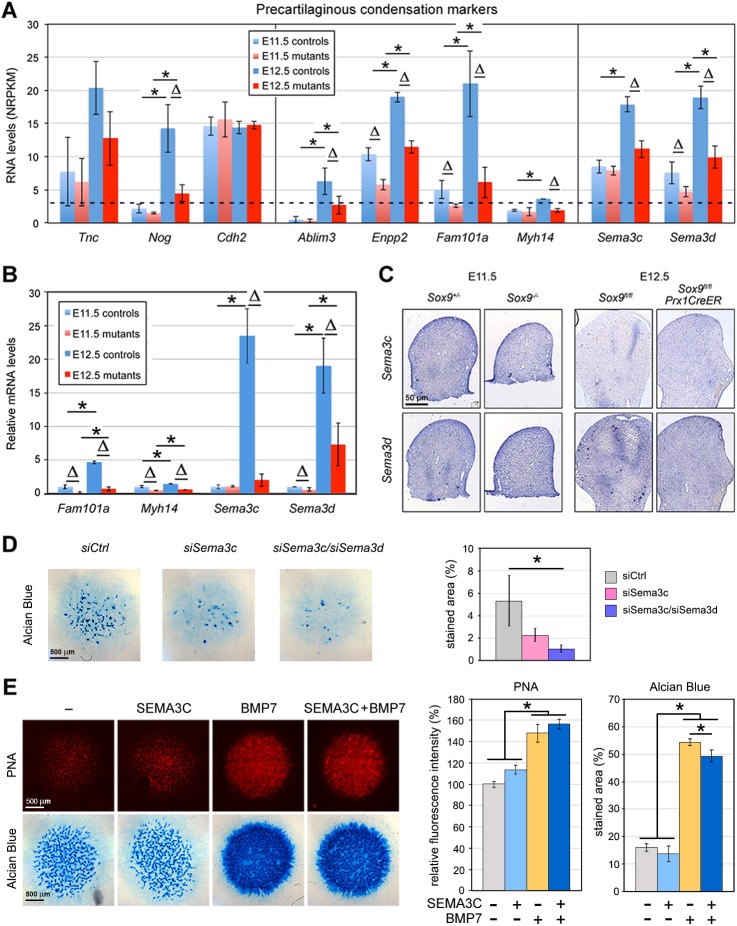
Impact of SOX9 on PC marker expression. (A) RNA levels measured using RNA-seq for PC markers in E11.5 Sox9fl/− and Sox9−/− and E12.5 Sox9fl/fl and Sox9fl/flPrx1CreER embryo limb buds. Values are expressed as mean±s.d. for three to four biological replicates. The dotted line indicates the threshold value for significant expression (NRPKM=3). ΔP<0.05 for differences between controls and mutants; *P<0.05 for differences between E11.5 and E12.5 (Student's t-tests). (B) Relative RNA levels measured by qRT-PCR for PC markers. Data are normalized to values obtained in E11.5 controls. ΔP<0.05 for differences between controls and mutants; *P<0.05 for differences between E11.5 and E12.5 (Student's t-tests). (C) RNA ISH of E11.5 Sox9fl/− and Sox9−/− and E12.5 Sox9fl/fl and Sox9fl/flPrx1CreER embryo limb bud sections with Sema3c and Sema3d probes. (D) Effect of Sema3c and Sema3d silencing on chondrogenesis. Limb bud mesenchymal cells were transfected with siRNAs during micromass formation, as indicated. Micromasses were stained with Alcian Blue 5 days later. Left, representative pictures. Right, quantification of staining extent. The percentage of stained area is shown as mean±s.d. for triplicates. (E) Effect of exogenous SEMA3C on chondrogenesis. One day after plating, limb bud micromasses were treated with SEMA3C and BMP7 as indicated. PNA and Alcian Blue staining were performed 2 and 4 days later, respectively. Left, representative pictures. Right, quantification of staining. For PNA, mean fluorescence intensities were calculated for two or three replicates in two independent experiments. For Alcian Blue, the percentage of stained area was calculated using two or three replicates in two independent experiments. *P<0.05 for differences between experimental groups, as indicated in the graphs (one-way ANOVA and Bonferroni post-hoc tests).

