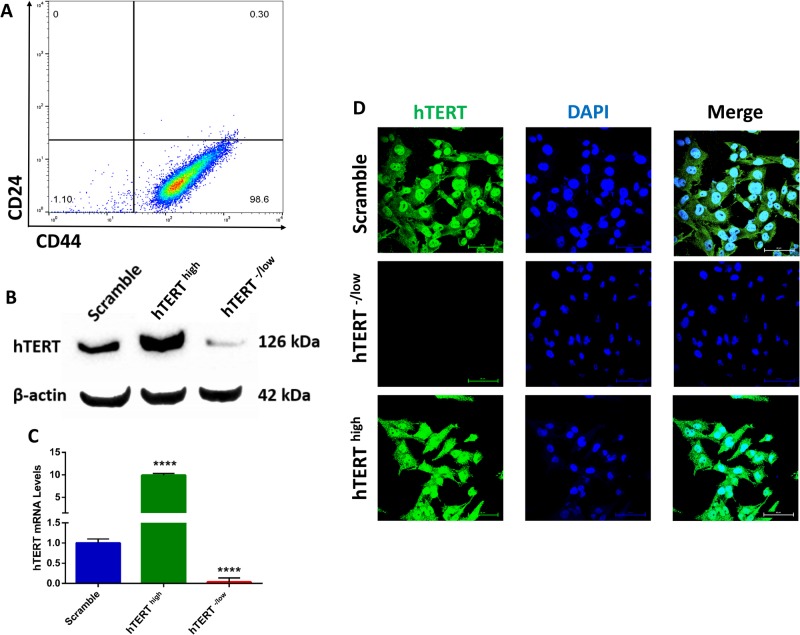
Fig. 1.
Verification of hTERT knockdown and overexpression in breast CSCs. (A) Flow cytometry plot for cell surface markers CD44 and CD24 in sorted CSCs confirming pure population. Gating is set to an isotype control. (B) Western blot analysis confirming hTERT knockdown and upregulation compared with control scrambled cells. β-actin was used to ensure the loading of equal amounts of protein. (C) Real-time qRT-PCR analysis of hTERT mRNA expression confirming downregulation and upregulation compared with control scrambled cells. β-Actin mRNA was used to normalize the variability in template loading. The data are reported as the means±s.d. (D) Confocal immunofluorescence images for hTERT (green) confirming hTERT knockdown. Nuclei were stained with DAPI (blue). Scale bars: 60 µM.

