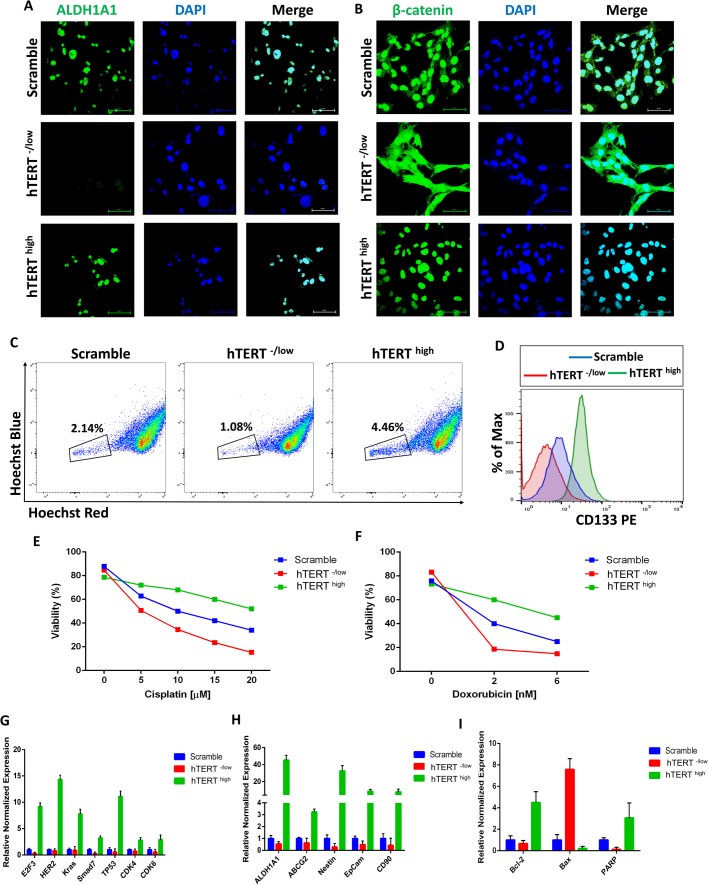
Fig. 4.
hTERT defines CSC properties. (A) Confocal immunofluorescence images for ALDH1A1 (green) showing that hTERThigh CSCs are positive for ALDH1A1, whereas hTERT-/low CSCs do not express ALDH1A1. Nuclei were stained with DAPI (blue). Scale bars: 60 µM. (B) Confocal immunofluorescence images for β-catenin (green) showing cytoplasmic localization of β-catenin in hTERT-/low CSCs, whereas hTERThigh CSCs showed nuclear localization of β-catenin. Nuclei were stained with DAPI (blue). Scale bars: 60 µM. (C) Side population (SP) analysis by flow cytometry indicating more SP cells in hTERThigh CSCs than in hTERT-/low CSCs, which have fewer SP cells than do control CSCs. (D) Flow cytometry analysis of CD133 showing that hTERThigh CSCs have higher CD133 expression than do control CSCs, whereas hTERT-/low CSCs are negative for CD133 expression. An isotype control was used to define the positive and negative populations. (E–F) hTERThigh CSCs, hTERT-/low CSCs and control CSCs were exposed to increasing concentrations of cisplatin (E) or doxorubicin (F) for 24 h. Cell viability was determined by Annexin-V-FITC and PI apoptosis detection kits. hTERThigh CSCs showed more significant resistance to cisplatin and doxorubicin than did control CSCs, whereas hTERT-/low CSCs exhibited a relative loss of chemoresistance capabilities (P<0.05). (G) The expression levels of the cancerous markers E2F3, HER2, KRas, SMAD7, TP53, CDK4 and CDK6 are higher in hTERThigh CSCs as determined by real-time qRT-PCR. The data are reported as the means±s.d. (H) Real-time qRT-PCR analysis of CSC marker genes showing higher expression levels in hTERThigh CSCs. β-actin mRNA was used to normalize variability in template loading. The data are reported as the means±s.d. (I) Real-time qRT-PCR analysis of Bcl-2 (an anti-apoptotic protein) and Bax (a pro-apoptotic molecule indicating a significantly increased expression of Bcl-2 and reduced expression of Bax in hTERThigh CSCs compared with that in control CSCs (P<0.05). β-actin mRNA was used to normalize the variability in template loading. The data are reported as the means±s.d.

