
Fig. 1.
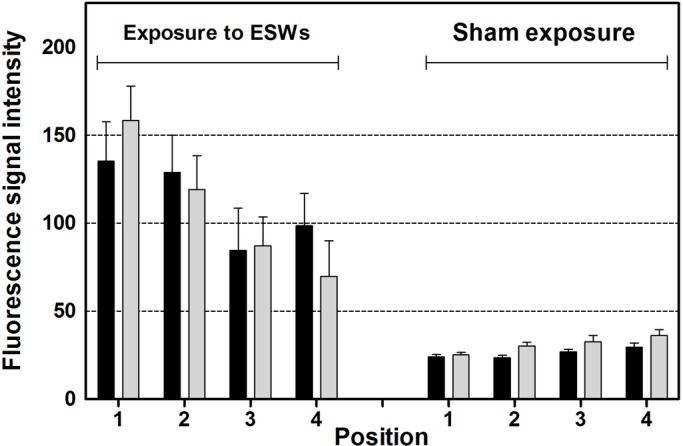
Results of quantitative analysis. The panel shows mean and standard error of the mean of the averaged fluorescence signal intensity (Calcein fluorescence imaging) per pixel found at different positions (1-4; explained in detail in Fig. 6C) over the hypostracum of the left valves (black bars) and the right valves (light gray bars) of the mussels two weeks after exposure to extracorporeal shock waves (ESWs) (on the left) or sham exposure (on the right) and incubation in Calcein for 24 h immediately after exposure to ESWs or sham exposure (n=12 mussels per group).