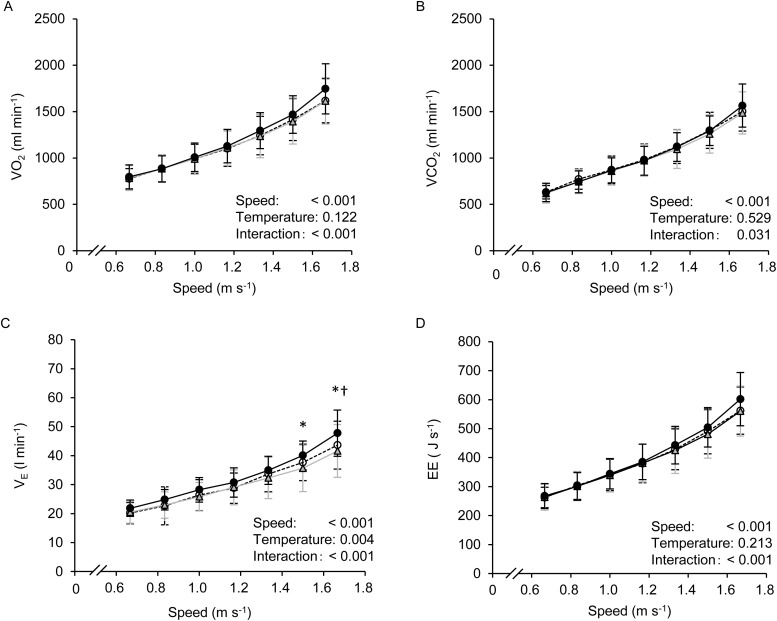
Fig. 1.
Changes in  (A),
(A),  (B),
(B),  (C), and EE (D) at all gait speeds in thermoneutral (○; 23°C), cool (Δ; 13°C), and hot (●; 33°C) conditions. Values are means±standard deviation (s.d.).
  oxygen uptake;
  , carbon dioxide output;
  , pulmonary ventilation; EE, energy expenditure. *P<0.05 between 33°C and 13°C, †P<0.05 between 33°C and 23°C.

