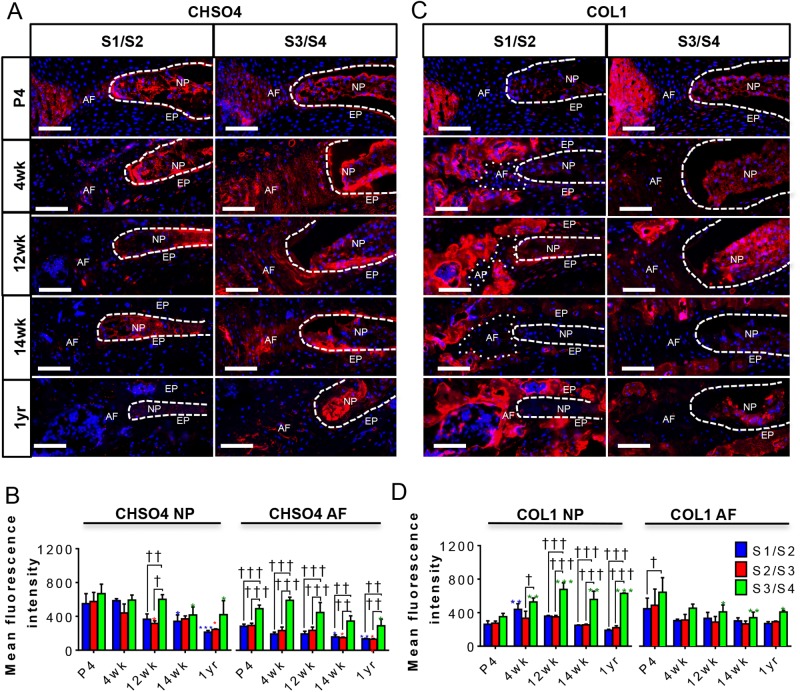
Fig. 3.
Expression of SHH targets and ECM markers in sacral IVDs with aging. (A-D) This figure is in a tabular form and shows the immunostaining and quantification of CHSO4 (A,B), and COL1 (C,D) in the S1/S2, S2/S3 (quantification data only) and S3/S4 discs of male FVB mice at P4, 4 weeks, 12 weeks, 14 weeks, and 1 year of age. N=3 each. Scale bars: 100 μm. Nuclei are counter-stained with DAPI in all images. Mean±s.e.m. Two-way ANOVA. †P<0.05, ††P<0.01, †††P<0.001 compares data under bars *P<0.05, **P<0.01, ***P<0.001 compares data under asterisk to its P4 value.

