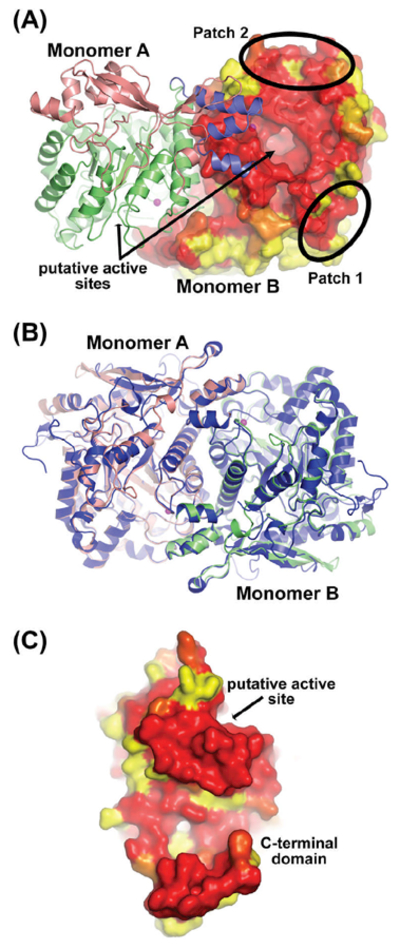
Fig.3.

Conservation and similarities of the A. thaliana THIC structure compared to its bacterial counterpart. (A) Mixed cartoon and surface representation of the A. thaliana THIC dimer. Monomer A is colored as in Fig.2A and monomer B is shown in molecular surface mode colored according to sequence conservation (yellow for no conservation, red for full conservation). The sequence alignment used to calculate the conservation is provided in the supplementary information (Fig. S2). The two black ellipses indicate conserved sequence patches that are referred to in the text. (B) Superimposition of the dimeric THIC atomic models from C. crescentus (in dark blue) and A. thaliana (in salmon and green). (C) The ΔN71–AtTHIC is shown from the interface side to appreciate the high sequence conservation. The THIC monomer is shown in molecular surface mode colored as in panel A.
