Fig. 2.
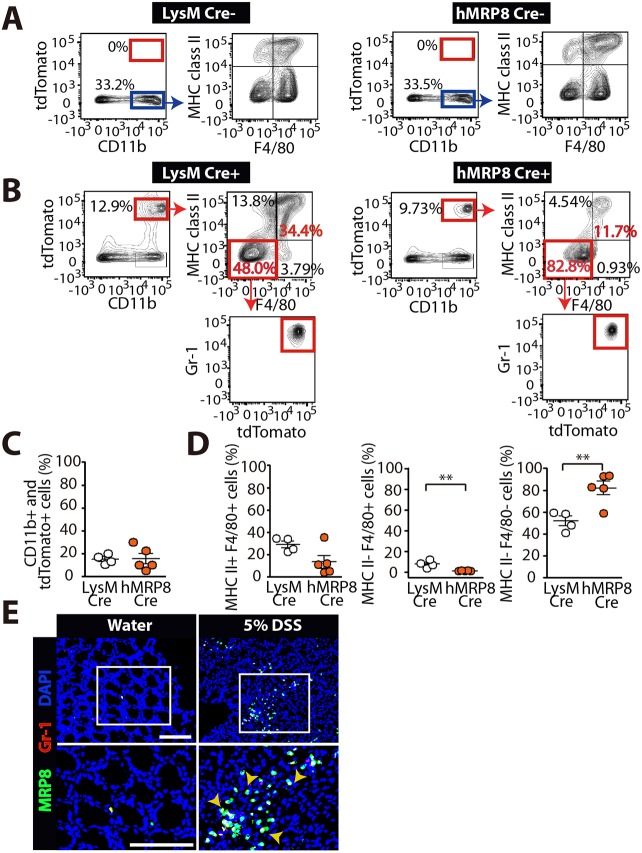
The hMRP8 myeloid promoter targets Gr-1-positive myeloid cells in the colon. (A) FACS plots searching for tdTomato-positive populations of cells (red boxes) in the colon of offspring mice not bearing the Cre transgene from breeders of LysM Cre (left) or hMRP8 Cre (right) with tdTomato mice. These mice were fed with 5% DSS for 4 days prior to FACS analyses. Note that tdTomato-negative and CD11b-positive myeloid populations (blue boxes) demonstrate similar immunophenotype for MHC class II and F4/80. (B) FACS analyses in the colon of offspring mice bearing the Cre transgene that had been fed with 5% DSS. (C) Quantification of tdTomato-positive cells that were also CD11b-positive colonic myeloid cells (red boxes in B) for LysM (n=4 mice) and hMRP8 (n=5 mice) promoters. (D) Frequencies of different myeloid cell populations (red boxes in B) among the tdTomato and CD11b double-positive population in C. **P<0.01, determined by Student's t-test. Data are mean±s.e.m. (E) Images of the colon of mice fed with water or 5% DSS, immunostained for MRP8 (green) and Gr-1 (red). DAPI-stained nuclei are shown in blue. White boxes indicate the areas magnified in the images shown below. Yellow arrowheads indicate cells with MRP8 and Gr-1 colocalization. Scale bars: 100 μm.

