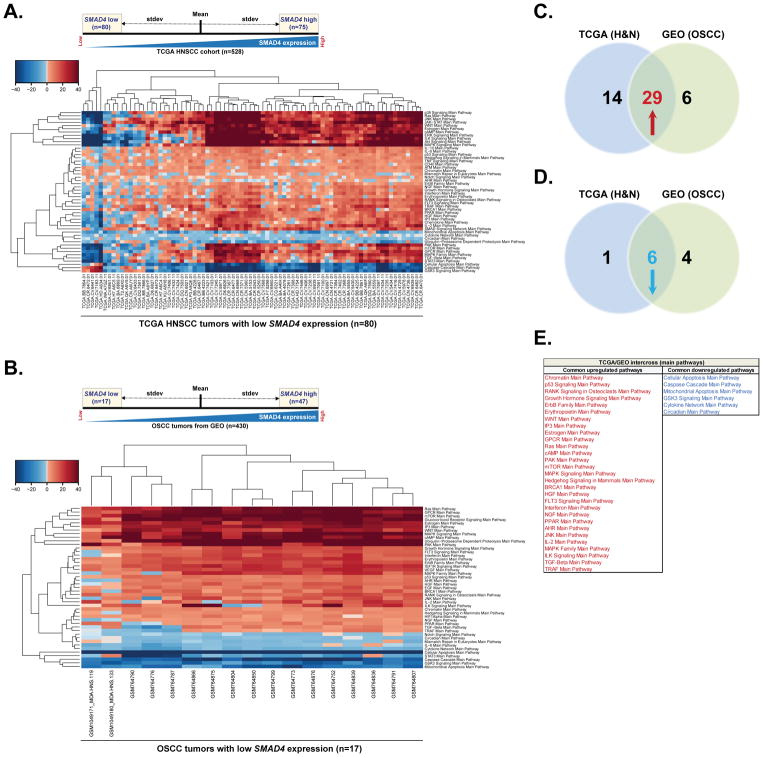
Figure 1. SMAD4 expression correlates with dysregulation of cancer promoting pathways.
(A). SMAD4 RNA-Seq mRNA expression in the TCGA HNSCC cohort (n=528) was categorized as high level (one standard deviation above the mean) or low level (one standard deviation below the mean) and pathway activation strength (PAS) values have been calculated according to OncoFinder algorithm. Hierarchically clustered heatmap represents differentially activated pathways in 80 tumors with low SMAD4 mRNA expression (75 tumors with high SMAD4 expression were used as a reference). Downregulated PAS values for each sample/pathway are indicated in blue, whilst upregulated PAS values are shaded in red. (B) Gene expression microarray data for 430 OSCC patients was retrieved from publicly available NCBI GEO repository database. Tumors were categorized based on the SMAD4 mRNA expression level and PAS values were then calculated as described in (A). Hierarchically clustered heatmap represents differentially activated pathways in 17 tumors with low SMAD4 mRNA expression. 47 tumors with high SMAD4 expression were used as a reference. Downregulated PAS values for each sample/pathway are indicated in blue, whilst upregulated PAS values are shaded in red. (C) Venn diagram summarizing the number of upregulated pathways predicted in tumors with low SMAD4 expression form TCGA HNSCC cohort, GEO database or both. (D) Venn diagram summarizing the number of downregulated pathways predicted in tumors with low SMAD4 expression form TCGA HNSCC cohort, GEO database or both. (E) List of commonly up- or downregulated pathways predicted in tumors with low SMAD4 expression in both TCGA and GEO datasets.

