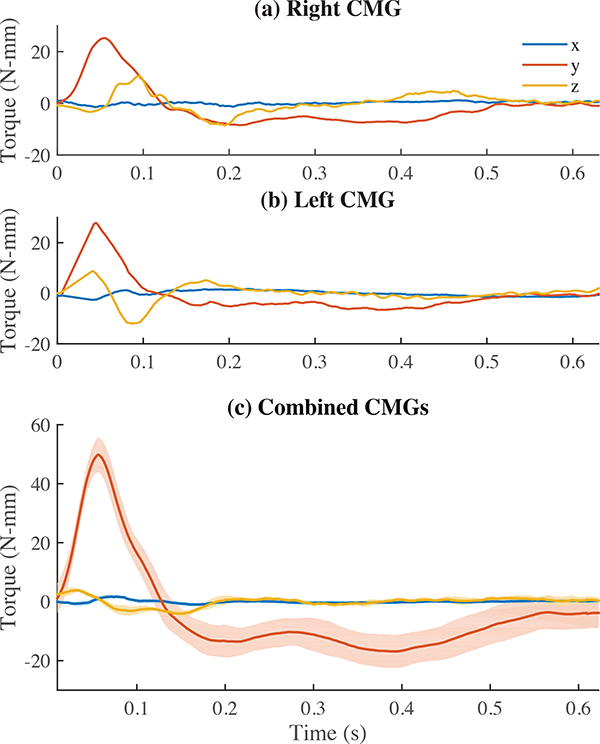
Fig. 5.

Output torque pulse magnitudes in the y direction. (a) and (b) show the two CMG components separately. (c) When both CMGs pulse, the x and z components cancel to approximately zero, and the y components sum. Here, the mean torque for ten repeated pulses is plotted about each axis and shown with an envelope depicting the standard deviation.
