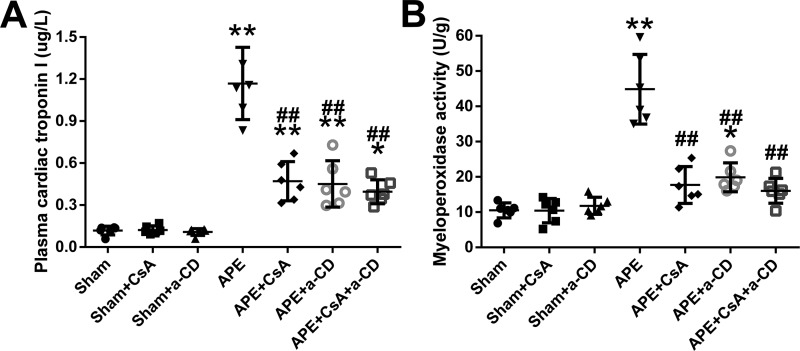
Figure 4.
Plasma cTnI and myeloperoxidase activity of unit weight right ventricular tissue at 24 h after APE in all experimental groups are shown in A and B. Data are mean ± S.D. *, p < 0.05; **, p < 0.01 versus sham group; ##, p < 0.01 versus APE control group (n = 6, each group). a-CD = mAb of CD147.

