Figure 6.
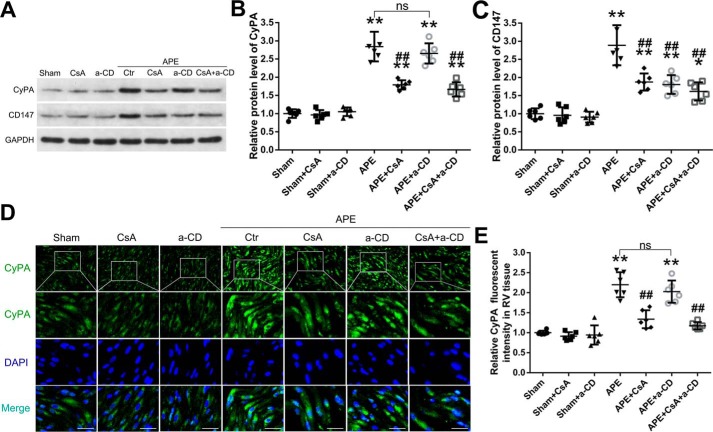
Effects of CsA and mAb of CD147 (a-CD) on the expressions of CyPA and CD147. A, Western blot analysis of the protein levels of CyPA and CD147 in RV tissues in rats of each group. B and C, quantification of the protein levels of CyPA and CD147. Protein levels were normalized to that of GAPDH. D, immunofluorescence analysis was performed using CyPA antibodies, and nuclei were fluorescently labeled with 4,6-diamino-2-phenylindole (DAPI) (blue). Scale bar, 50 μm. E, relative fluorescent intensity of CyPA. B, C, and E, mean values for sham group were normalized to 1.0. Data are mean ± S.D. *, p < 0.05; **, p < 0.01 versus sham group; ##, p < 0.01 versus APE control group; ns, no statistical significance (n = 6, each group).

