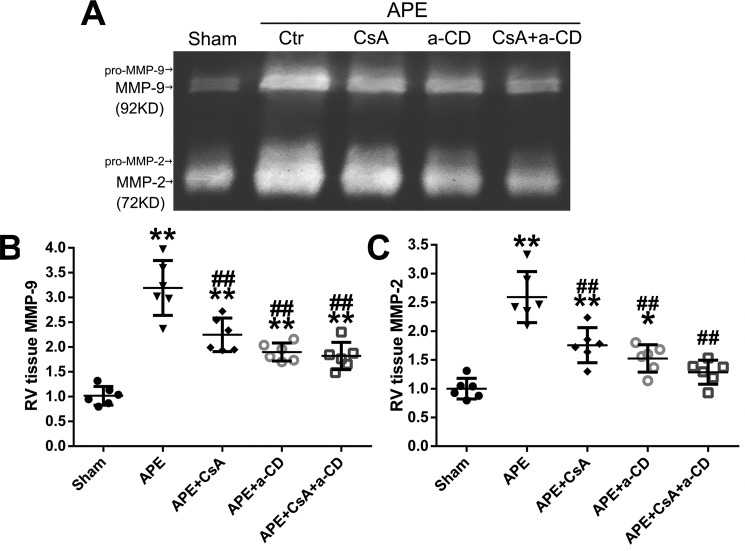
Figure 8.
Effects of CyPA/CD147 on the level of MMP-9 and MMP-2. A, representative zymogram of RV tissue extract showing MMP-9 and MMP-2 bands in sham, APE, APE + CsA, APE + mAb of CD147 (a-CD), and APE + CsA + a-CD groups. B and C, quantification of the levels of MMP-9 and MMP-2. Mean values for sham group were normalized to 1.0. Data are mean ± S.D. *, p < 0.05; **, p < 0.01 versus sham group; ##, p < 0.01 versus APE control group (n = 6, each group).

