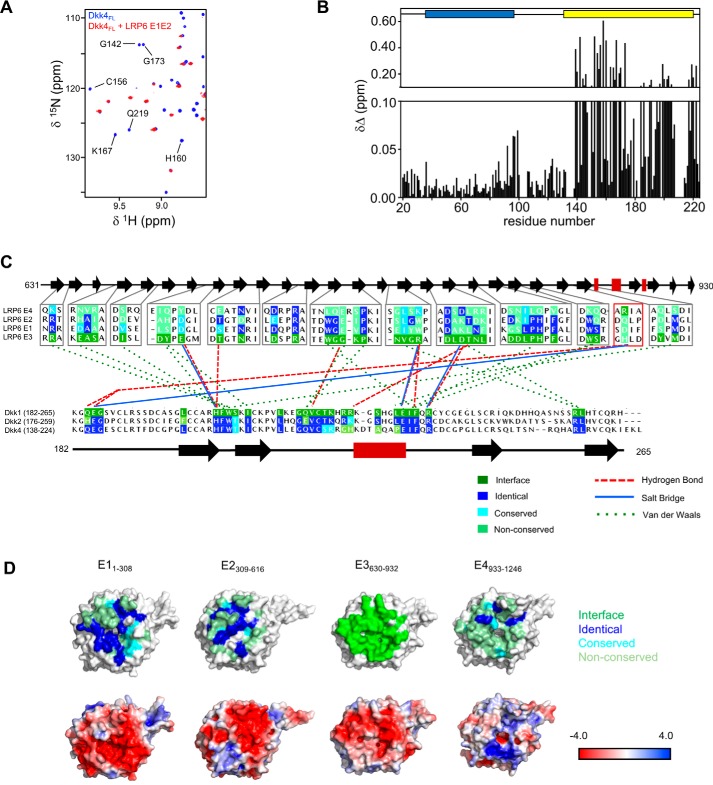
Figure 5.
Mapping of the LRP6 E1E2 interaction site on Dkk4. A, overlay of selected regions from the 15N/1H TROSY spectra of uniformly 15N/13C/2H-labeled Dkk4FL acquired in the absence (blue) and presence (red) of a 10% molar excess of unlabeled LRP6 E1E2. A selection of the well-resolved signals from Dkk4 CRD2 that are lost on binding to LRP6 E1E2 are labeled by residue type and number. B, minimum chemical shift perturbation observed for backbone amide groups of His-tagged Dkk4FL induced by the addition of LRP6 E1E2. The positions of CRD1 and CRD2 are shown above the histogram as blue and yellow boxes, respectively. C, a summary of the key interactions observed between LRP6 E3 (gray boxes), a four-residue stretch of E4 (red box), and Dkk1 CRD2 in the highest-resolution reported crystal structure (PDB accession code 3S2K). Only the regions of LRP6 E1–E4 located at the binding interface are included in the multiple-sequence alignment shown. The multiple-sequence alignments shown for LRP6 E1–E4 and Dkk1–4 CRD2 indicate high conservation of the E3–Dkk1 CRD2 binding interfaces on LRP6 E1 and E2, and of the LRP6-binding site on the CRD2 domain of Dkk2 and Dkk4. A schematic of the regular secondary structure in both proteins is shown above or below the relevant multiple-sequence alignments, with black arrows and red rectangles representing β-sheets and α-helices, respectively. Residues found at the interaction site are highlighted in green. D, surface views of the potential Dkk CRD2-binding surface on LRP6 E1–E4. Electrostatic potential and sequence conservation compared with the Dkk1 CRD2 interaction site on LRP6 E3 are shown on the crystal structures of E1, E2, and E4 (PDB codes 4DG6 for LRP6 E1E2 and 3S2K for LRP6 E3E4).

