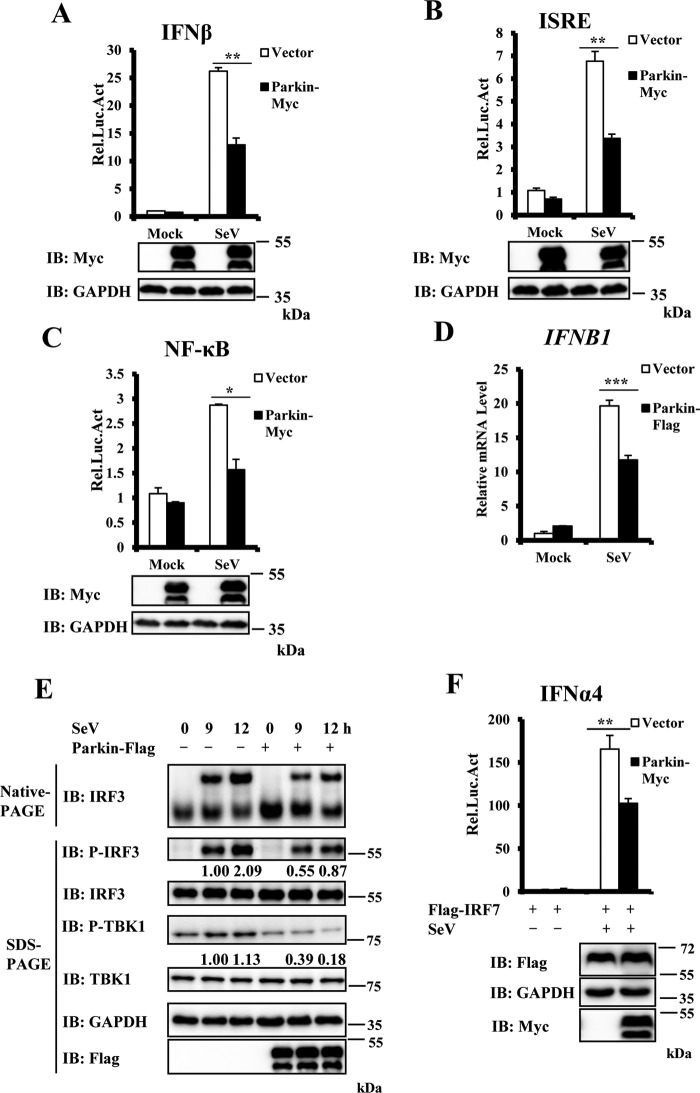
Figure 1.
Overexpression of Parkin inhibits SeV-induced antiviral signaling. A–C, overexpression of Parkin reduced SeV-induced activation of the IFN-β, ISRE, and NF-κB promoters. HeLa cells were co-transfected with the indicated expression plasmids and luciferase reporter constructs driven by promoter of gene encoding IFN-β (A), ISRE (B), or NF-κB (C). pRSV/lacZ was used as an internal control. 24 h after transfection, the cells were infected with SeV for 24 h and then lysed for luciferase assays (upper panel) and immunoblotting (IB) assays (lower panels). D, Parkin overexpression decreased SeV-induced transcription of the IFNB1 gene. HEK293 cells were transfected with the indicated expression plasmids. 24 h after transfection, the cells were infected with SeV for 6 h, and cell lysates were analyzed by qRT–PCR to examine IFNB1 mRNA levels. E, overexpression of Parkin reduced SeV-induced IRF3 dimerization and IRF3 and TBK1 phosphorylation. HEK293 cells were transfected with the indicated expression plasmids. 24 h after transfection, the cells were left untreated or infected with SeV for the indicated times. The cell lysates were resolved by native gel electrophoresis (upper panel) or SDS–PAGE (lower panels) and analyzed with the indicated antibodies. F, overexpression of Parkin reduced SeV-induced activation of the IFN-α4 promoter. HEK293 cells were co-transfected with the indicated expression plasmids and luciferase reporter construct driven by promoter of gene encoding IFN-α4. Renilla was used as an internal control. 24 h after transfection, the cells were infected with SeV for 24 h and then lysed for luciferase assays (upper panel) and immunoblotting assays (lower panels). The data in A–D and F are from a representative experiment of at least three independent experiments (means ± S.D. of duplicate assays in A–C and F; triplicate experiments in D). Two-tailed Student's t test was used to determine statistical significance. *, p < 0.05:, **, p < 0.01; ***, p < 0.001, versus control groups. The numbers below lanes in E indicate densitometry of the protein presented relative to IRF3 (top) or TBK1 expression in the same lane. Rel. Luc. Act, relative luciferase activity.

