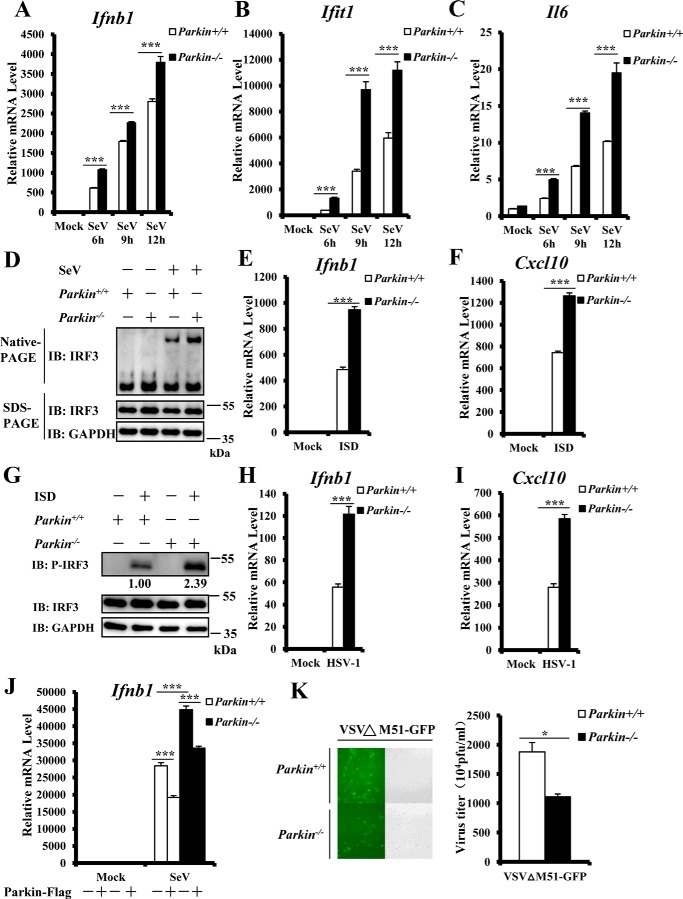
Figure 2.
Enhanced antiviral response in Parkin-deficient MEFs. A–C, Parkin deficiency significantly enhanced SeV-induced transcriptional levels of antiviral genes. Primary Parkin+/+ and Parkin−/− MEFs were infected with SeV for the indicated times. MEFs were then harvested to isolate RNA and measure transcript levels of Ifnb1 (A), Ifit1 (B), and Il6 (C) by qRT–PCR analysis. D, Parkin deficiency increased SeV-induced IRF3 dimerization. Primary Parkin+/+ and Parkin−/− MEFs were left untreated or infected with SeV for 9 h. The cell lysates were separated by native gel electrophoresis (upper panel) or SDS–PAGE (lower panels) and analyzed by immunoblotting (IB) with the indicated antibodies. E and F, ISD-induced transcriptional levels of antiviral genes were increased in Parkin−/− MEFs. Primary Parkin+/+ and Parkin−/− MEFs were transfected with ISD (2 μg/ml) for 3 h, followed by qRT–PCR analysis to measure transcript levels of Ifnb1 (E) and Cxcl10 (F). G, IRF3 phosphorylation induced by ISD was increased in Parkin−/− MEFs. Primary Parkin+/+ and Parkin−/− MEFs were left untreated or transfected with ISD (2 μg/ml) for 3 h. The cell lysates were separated by SDS–PAGE and analyzed by immunoblotting with the indicated antibodies. H and I, Parkin deficiency enhanced transcriptional levels of antiviral genes induced by HSV-1 infection. Primary Parkin+/+ and Parkin−/− MEFs were infected with HSV-1 at a MOI of 5 for 3 h, followed by qRT–PCR analysis to measure transcript levels of Ifnb1 (H) and Cxcl10 (I). J, overexpression of mouse Parkin could reverse the enhancement of Ifnb1 expression induced by SeV infection in Parkin−/− MEFs. Primary Parkin+/+ and Parkin−/− MEFs were first infected with a retrovirus expressing Parkin or an empty vector. After 48 h of infection, the cells were infected with SeV for 6 h, followed by qRT–PCR analysis to measure Ifnb1 transcript levels. K, Parkin deficiency suppressed the amplification of VSVΔM51-GFP. Primary Parkin+/+ and Parkin−/− MEFs were infected with vesicular stomatitis mutant virus (VSVΔM51-GFP) at MOI of 0.01 for 36 h. The cells were imaged by fluorescence microscopy (left panel) or culture supernatants collected to measure viral titer by plaque assay (right panel). The data in A–C, E, F, and H–K are from a representative experiment of at least three independent experiments (means ± S.D. of triplicate experiments in A–C, E, F, and H–J and duplicate experiments in K). Two-tailed Student's t test was used to determine statistical significance. *, p < 0.05; ***, p < 0.001, versus control groups. Numbers below lanes (top) in G indicate densitometry of the protein presented relative to IRF3 expression in the same lane.

