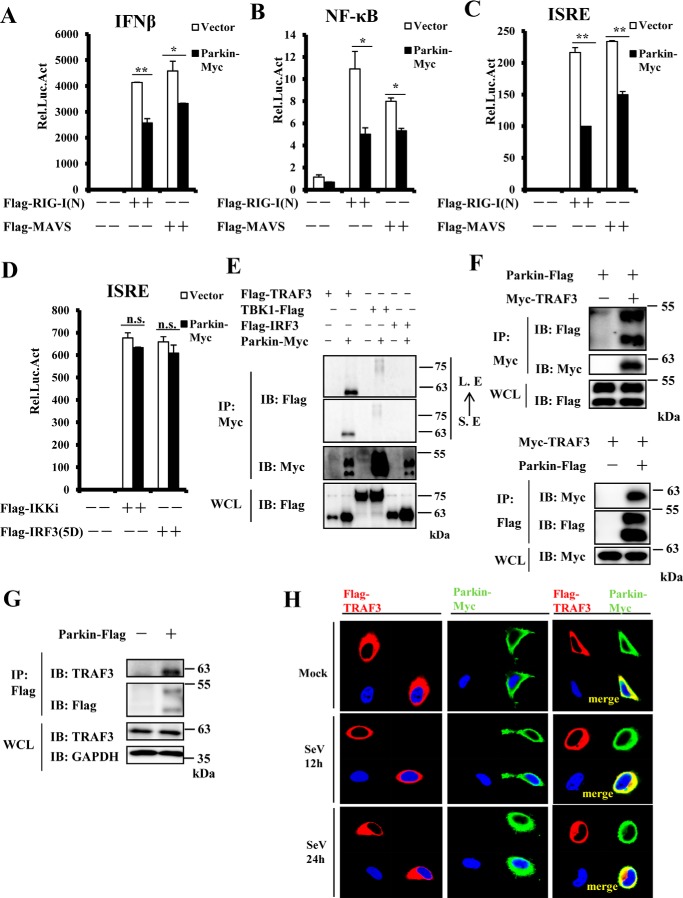
Figure 4.
Identification of TRAF3 as a Parkin-interacting protein. A–C, overexpression of Parkin reduced RIG-I(N)- and MAVS-mediated activation of the IFN-β, NF-κB, and ISRE promoters. HEK293 cells were co-transfected with the indicated expression plasmids and luciferase reporter constructs driven by the promoter of gene encoding IFN-β (A), NF-κB (B), or ISRE (C). Renilla was used as an internal control. 24 h after transfection, the cells were lysed for luciferase assays. D, Parkin overexpression failed to suppress activation of the ISRE promoter induced by IKKi and IRF3–5D. HEK293 cells were co-transfected with the indicated expression plasmids and a luciferase reporter construct driven by the promoter of the gene encoding ISRE, with Renilla used as an internal control. 24 h after transfection, the cells were lysed for luciferase assays. E and F, Parkin interacted with TRAF3. HEK293 cells were transfected with the indicated expression plasmids. 24 h after transfection, the cell lysates were immunoprecipitated with anti-Myc beads or anti-Flag beads and analyzed by immunoblotting (IB) with the indicated antibodies. Bottom panel of E or F, respectively, expression of exogenous proteins in WCL. G, endogenous TRAF3 interacted with exogenous Parkin in HEK293 cells. HEK293 cells were transfected with empty vector or Parkin Flag-tagged plasmids. 24 h after transfection, lysates were immunoprecipitated with anti-Flag beads, followed by immunoblotting with the indicated antibodies. Bottom panel, expression of endogenous proteins in WCL. H, Parkin was co-localized with TRAF3 in transfected HeLa cells in the presence or absence of SeV infection. HeLa cells were transfected with the indicated expression plasmids. 24 h after transfection, the cells were untreated or infected with SeV for the indicated times, then fixed, and stained with DAPI, anti-Flag, and anti-Myc antibodies. The cells were observed by confocal microscopy. The data shown in A–D are from a representative experiment of at least three independent experiments (means ± S.D. of duplicate assays). Two-tailed Student's t test was used to determine statistical significance. *, p < 0.05; **, p < 0.01; n.s., not significant, versus control groups. S. E, short exposure; L. E, long exposure; Rel. Luc. Act, relative luciferase activity.

