
Figure 3.
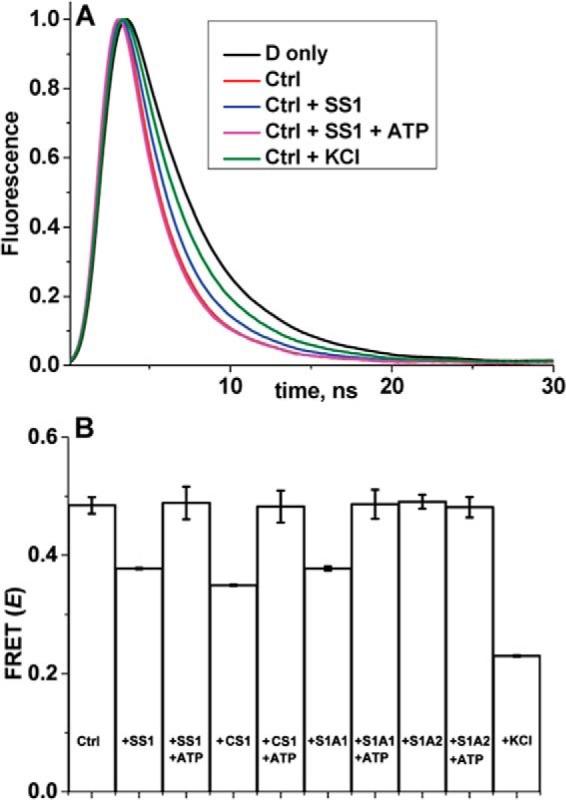
Actin–ANT FRET. A, representative fluorescence decays of donor-labeled actin (2 μm) in the absence (D only, black, same as D-actin in Fig. 2A) and presence of 50 μm ANT (Ctrl, red, same as D-actin + 50 μm ANT in Fig. 2A) and after the addition to Ctrl of saturating (5 μm) skeletal S1 (blue), S1 + saturating (3 mm) ATP (magenta), or 0.1 m KCl (green). The D only (black) and Ctrl (red) decays are included in the present figure for visualization and comparison purposes. B, FRET between actin and ANT in the absence (Ctrl) and presence of different isoforms of S1 (skeletal SS1, cardiac CS1, skeletal S1A1, skeletal S1A2), without and with 3 mm ATP and 0.1 m KCl. Error bars, S.D.