Figure 2.
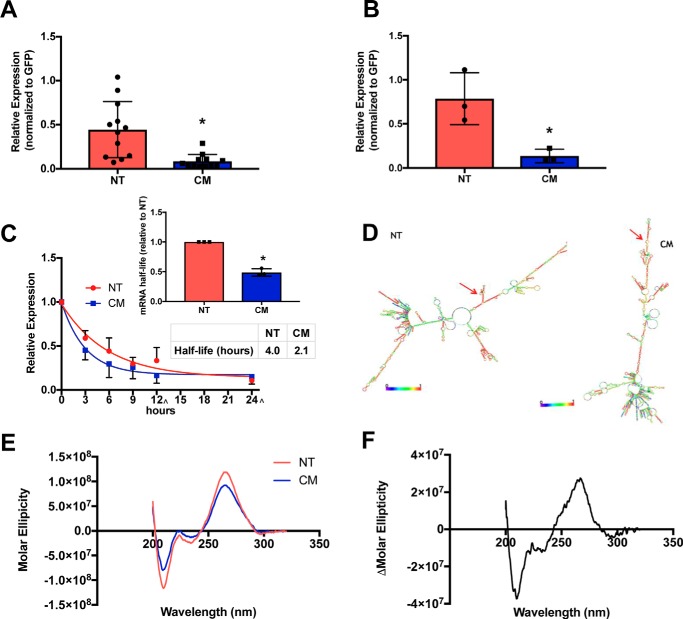
hERG-NT mRNA is synthesized at a greater rate, has an altered conformation, and a longer half-life than hERG-CM mRNA. A, hERG-NT and -CM mRNA expression levels 24 h post-transfection as determined by quantitative PCR. Four independent transfections were performed (n = 4) with three replicate primer groups per assay. Statistically significant difference (p = 0.0010) was determined by t test and indicated by an asterisk. B, rate of transcription of hERG-NT and hERG-CM determined with a 30-min 4-thiouridine pulse to label nascent mRNA synthesized 24 h post-transfection (n = 3). Statistically significant difference (p = 0.0209) was determined by t test and indicated by asterisk. C, results of one-phase decay analysis for hERG-NT and hERG-CM mRNA half-life determination using actinomycin-D to inhibit transcriptional 1-day post-transfection from three independent transfections (n = 3) with three replicate primer groups per assay. The 12-and 24-h collections were performed at +30 min in the sample 3 collection ([caret]). A bar graph represents the increases in mRNA half-life of hERG-NT compared with hERG-CM for each independent assay (inset). Statistical significance was determined by the difference in half-life values between NT and CM from three independent experiments using a t test (p = 0.0001) (inset) and by comparison of curve fit analysis (regression, p < 0.001). D, minimum free energy structure prediction from RNAFold for hERG-NT and hERG-CM mRNA. Red arrows demonstrate the AUG site. Global differences in the predicted mRNA structure can be noted between hERG-NT and hERG-CM. E, circular dichroism scans of hERG-NT and hERG-CM in in vitro-transcribed mRNA (n = 3). hERG-NT has a higher peak intensity than the hERG-CM peak. F, difference between the hERG-NT and hERG-CM CD spectra across the 320–200-nm wavelength.

