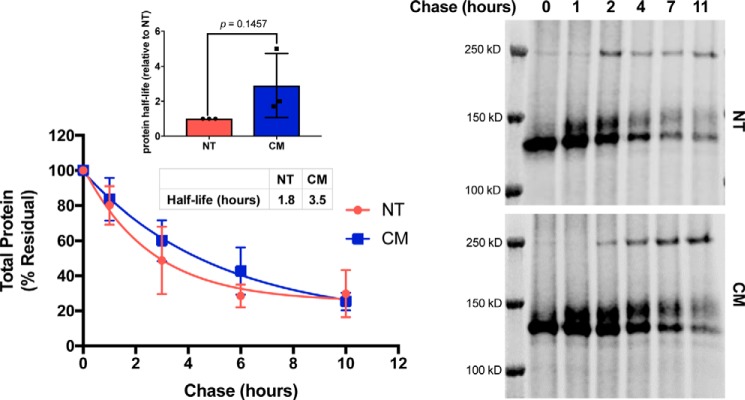
Figure 4.
hERG-CM half-life is increased. Graph and representative immunoblot of AHA pulse-chase to determine hERG-NT and hERG-CM protein half-life. Cells were transfected with 125 ng of hERG-NT or 500 ng of hERG-CM in an attempt to have comparable amounts of nascent protein produced during the 45-min pulse. The amount of residual signal for total protein is displayed. Results of one-phase decay for the hERG-NT and hERG-CM half-life determination are shown from three independent transfections (n = 3). Bar graph represents the increases in the determined half-life of hERG-CM compared with hERG-NT protein for each independent assay (inset). Differences in half-life were assessed by t test analysis. Statistical significance was not reached.

