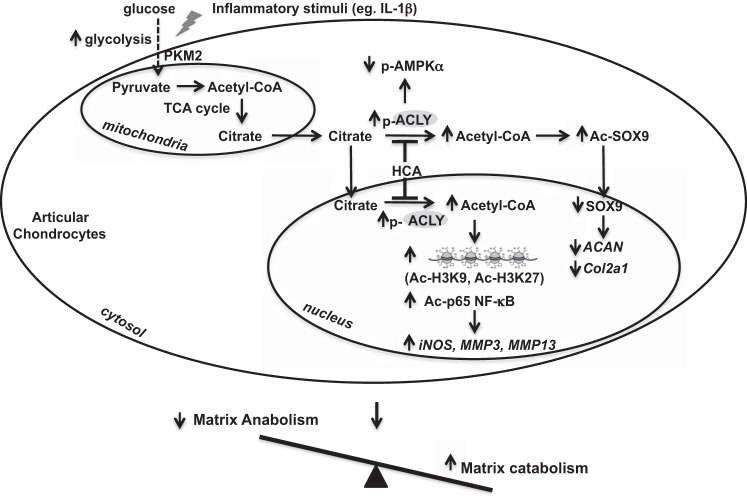
Figure 9.
Putative model of ACLY in cartilage matrix metabolism and OA. Shown is a schematic model that summarizes our results, in which pharmacologically targetable ACLY was increased in OA chondrocytes in situ and in response to increased glycolysis and IL-1β in vitro, with associated changes that could disrupt cartilage matrix homeostatic balance, leading to cartilage degradation, as discussed in detail in the text.

