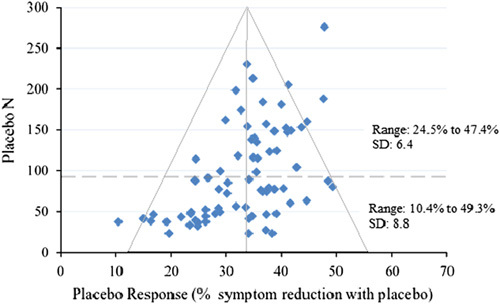
Fig. 1.

Funnel plot of placebo response plotted with placebo arm sample size. Dotted line represents the median split of placebo arm N (87 N: an unbiased threshold used to examine the differential effects of smaller and larger sample sizes).

Funnel plot of placebo response plotted with placebo arm sample size. Dotted line represents the median split of placebo arm N (87 N: an unbiased threshold used to examine the differential effects of smaller and larger sample sizes).