. 2018 Aug 2;7:e34152. doi: 10.7554/eLife.34152

Figure 2. Hepatic NIK deficiency upregulates cyclin D1 without altering NF-kB1, Akt, and MAPK pathways in the liver.

NIKf/f and NIKΔhep male mice (8 weeks) were subjected to PHx. (A–B) Liver extracts were immunoblotted with anti-cyclin D1 antibody (48 hr after PHx). Cyclin D1 levels were quantified and normalized to α-tubulin levels (NIKf/f: n = 4, NIKΔhep: n = 4). (C) Liver extracts were immunoblotted with the indicated antibodies (4 hr after PHx). (D) Liver ROS levels 48 hr after PHx (normalized to liver weight). NIKf/f: n = 5, NIKΔhep: n = 6. (E) Liver cytokine expression was measured by qPCR and normalized to 36B4 expression (48 hr after PHx). NIKf/f: n = 5, NIKΔhep: n = 5. Data were statistically analyzed with two-tailed Student’s t test, and presented as mean ± SEM. *p<0.05.
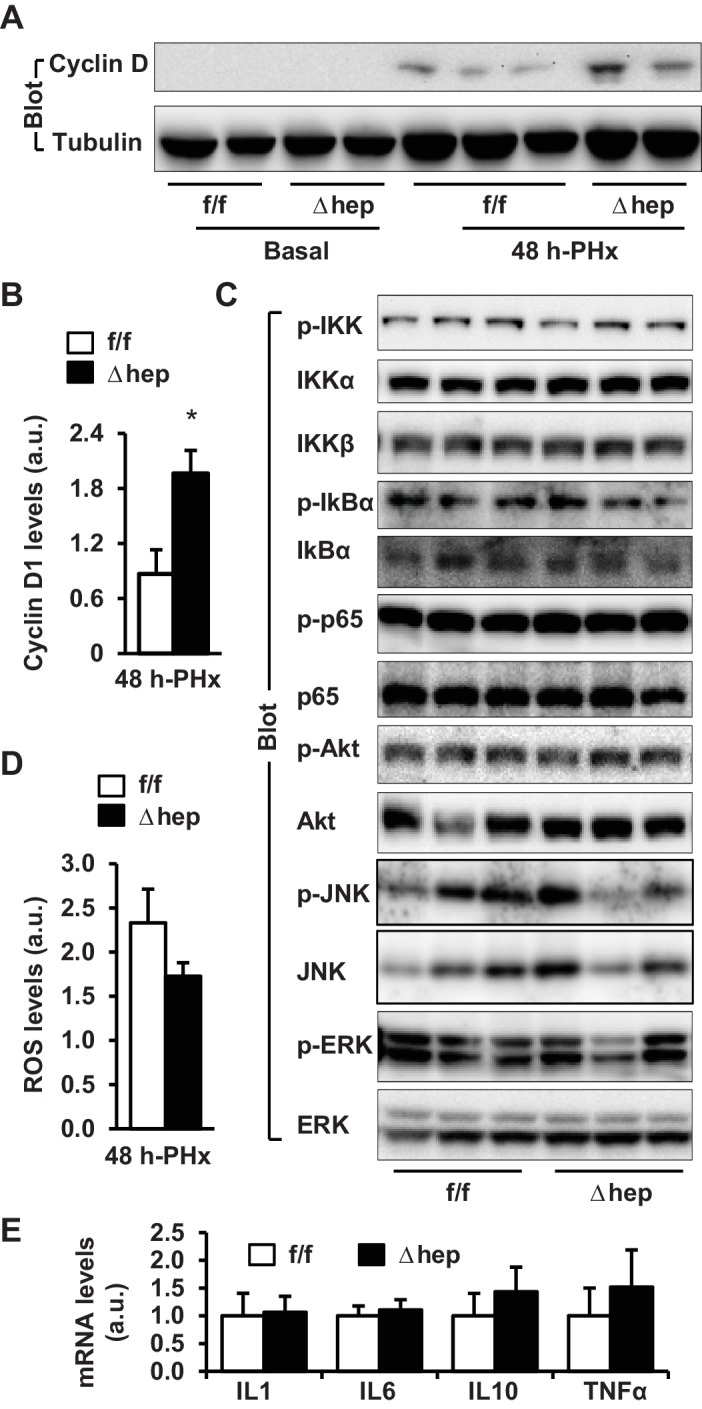
Figure 2—source data 1. Hepatic NIK regulates hepatocyte cell cycle progression.
DOI: 10.7554/eLife.34152.008

Figure 2.

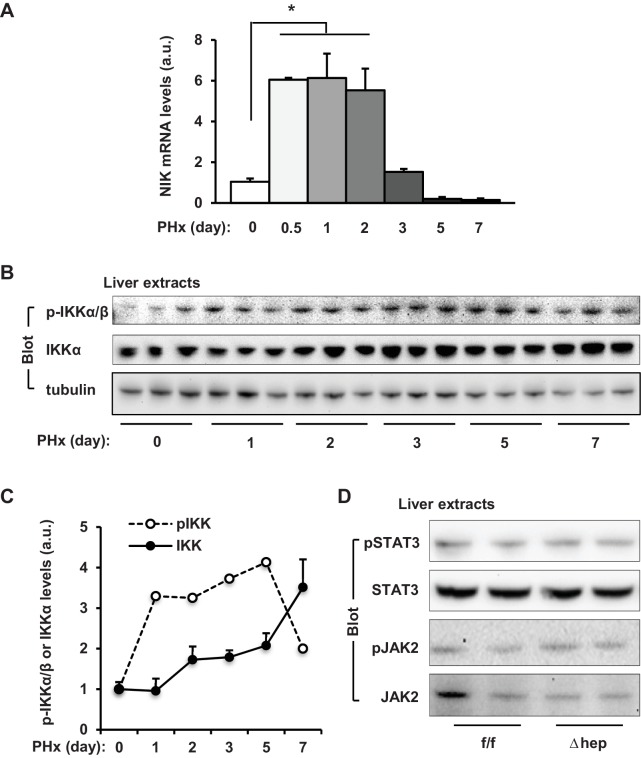
Figure 2—figure supplement 1. Effect of PHx on liver NIK pathway activation.

Figure 2—figure supplement 1.

PHx was performed on C57BL/6 male mice. (A) Liver NIK mRNA abundance was measured by qPCR (normalized to 36B4 levels, n = 3 per group). (B–C) Liver extracts were immunoblotted with antibodies against phospho-IKKα/β, IKKα and α-tubulin. Liver phospho-IKKα/β (normalized to IKKα levels) and IKKα (normalize to α-tubulin levels) levels were measured on days 0–7 following PHx. (D) PHx was performed on NIKf/f and NIKΔhep male mice. Liver extracts were prepared from resected livers and blotted with antibodies against phospho-STAT3, STAT3, phospho-JAK2, and JAK2. Data were statistically analyzed with two-tailed Student’s t test, and presented as mean ± SEM. *p<0.05.
Figure 2—figure supplement 1—source data 1. PHx stimulates hepatic NIK expression.
DOI: 10.7554/eLife.34152.007