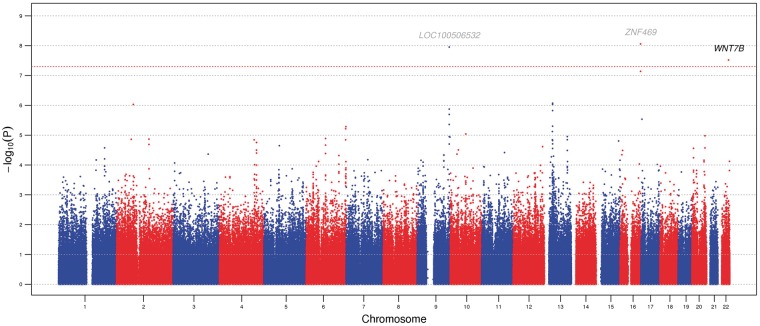
Figure 1.
A Manhattan plot presenting the –log10(P values) for the 576,798 SNPs included in the discovery set (stage 1) plotted by genomic position The red horizontal dotted line indicates the genome-wide significance level of P = 5.00 × 10⁻⁸. Loci previously associated with CCT are shown in grey (LOC100506532 and ZNF469) and the novel locus is shown in black (WNT7B).

