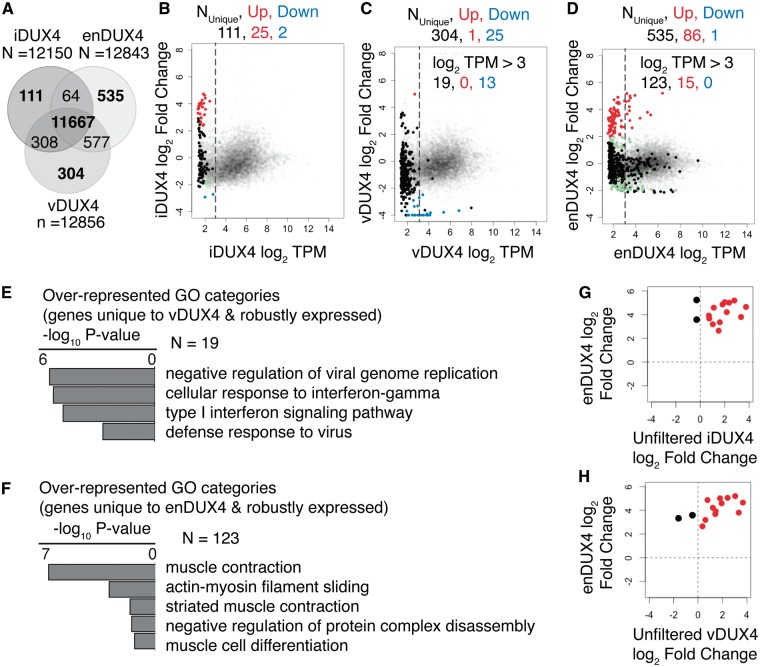
Figure 4.
Genes unique to endogenous DUX4 expression are most relevant to muscle differentiation. (A) Venn diagram showing the overlap between the detected genes in iDUX4, enDUX4 and vDUX4 samples. (B–D) MA plot for inducible, viral and endogenous DUX4-induced transcriptome, highlighting the genes that were uniquely detected in each of the samples. Dotted line represents log2 TPM of 3. Color scheme is same as that of Figure 3B–D. (E–F) Gene Ontology (GO) analysis for the genes unique to vDUX4 and enDUX4, respectively, and expressed at a level above 8 TPM (log2 TPM of 3). (G-H) Scatter plot of log2 fold-change of genes robustly and uniquely upregulated by enDUX4 versus log2 fold-change for the corresponding genes by iDUX4 (G) and vDUX4 (H) calculated without applying a filter for low expressing genes. Black dots represent the discordant genes.

