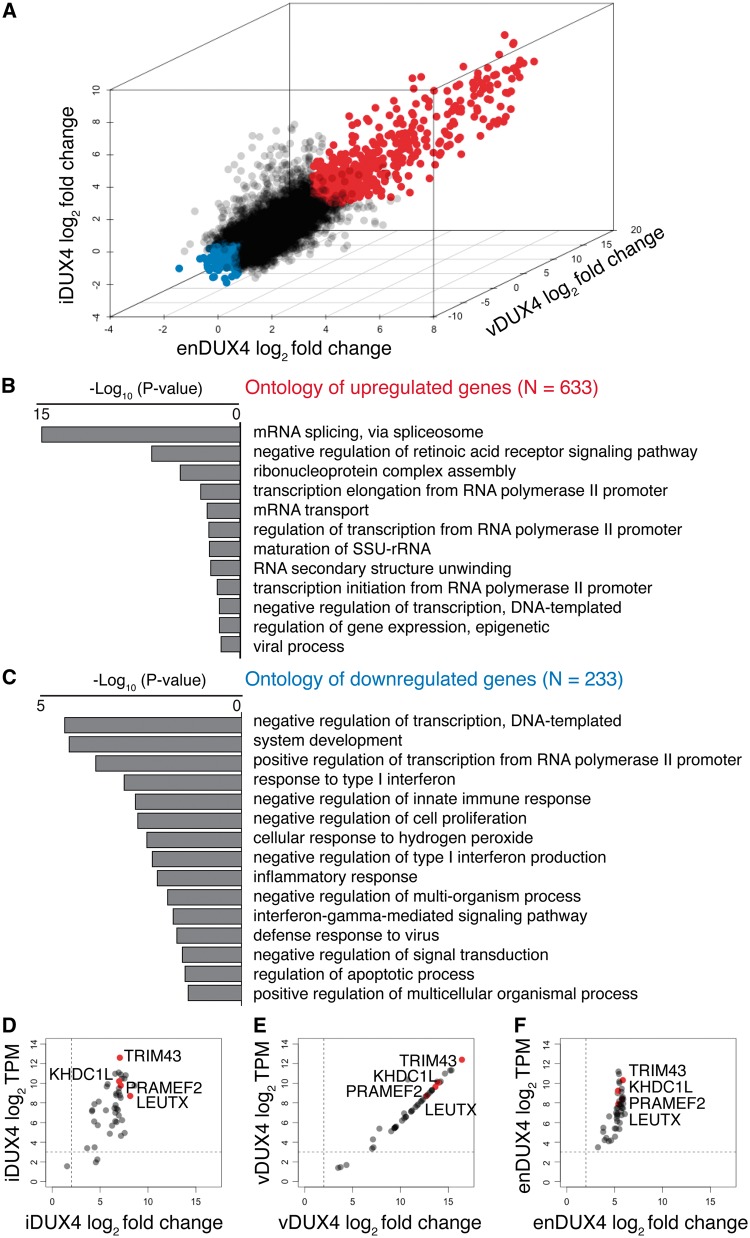
Figure 7.
Gene sets common to endogenous and exogenous DUX4 expression highlight the core functions of DUX4. (A) 3D scatter plot for the three datasets (iDUX4, enDUX4 and vDUX4) highlighting the genes upregulated by more than 2 log2 fold-change in all samples in red and those downregulated by more than 2 log2 fold-change in all samples in blue. (B) GO analysis of the upregulated genes (marked ‘red' in 6A). (C) GO analysis of downregulated genes (marked ‘blue' in 6A). (D–F) MA plot for 47 biomarkers identified by Yao et al. (17) for the iDUX4 (D), vDUX4 (E) and enDUX4 (F) datasets; The four high-confidence biomarkers (LEUTX, PRAMEF2, TRIM43, KHDC1L) are marked in ‘red'. The horizontal dotted line represents TPM of 8; the vertical dotted line represents fold change of 4.

