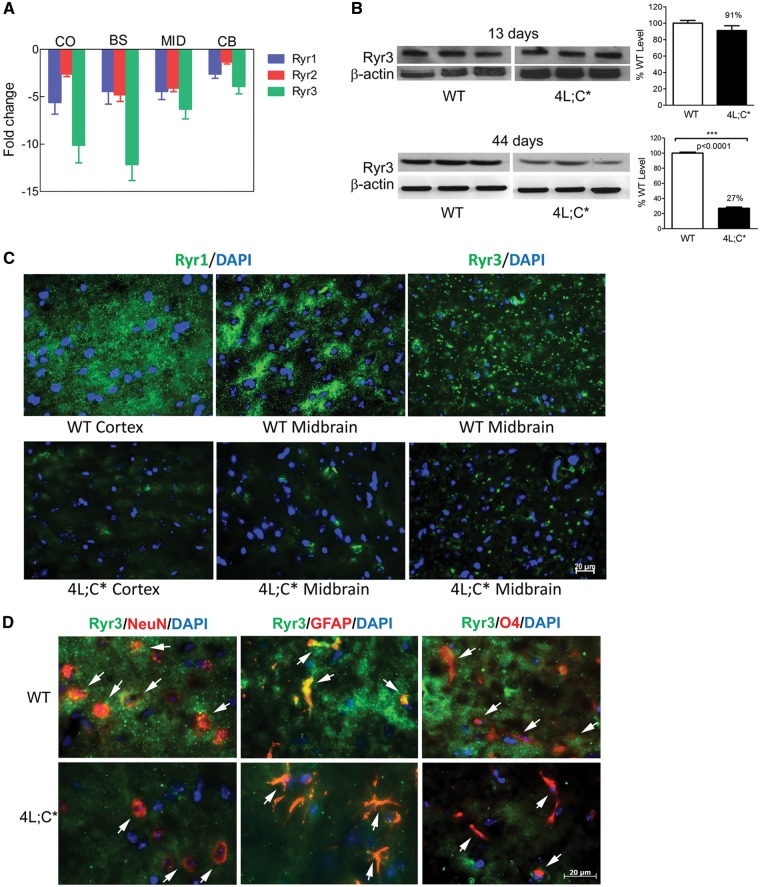
Figure 1.
Ryrs expression in 4L;C* mouse brains. (A) Decreased mRNA expression (fold change of WT level) of three Ryrs in 4L;C* brain regions determined by RNASeq analysis (n = 3 mice/group). (B) Immunoblot of brain lysate showed Ryr3 was expressed at normal levels at 13 days of age and significantly decreased by 44 days of age in 4L;C* brain (27% of WT level) compared to WT mice. P-values were from Student’s t-test, n = 3 mice/group, 2-4 replicates of the experiment. (C) Immunofluorescence staining of brain sections by anti-Ryr1 and anti-Ryr3 antibodies (green) showed decreased Ryr signals in 4L;C* brain including cortex and midbrain regions. Scale bar is 20 µm for all the images. (D) Co-staining of Ryr3 (green) with neural cell markers. NeuN (red) is for neurons. GFAP (red) is for astrocytes. O4 (red) is for oligodendrocytes. Ryr3 signals were detected in neurons, astrocytes and oligodendrocytes in WT midbrains. 4L;C* midbrain had low level of Ryr 3 signals in those cells compared to WT. Scale bar is 20 µm for all the images. DAPI (blue) stained cell nuclei. Images are representative from n = 3 mice for each genotype.

