
Figure 3.
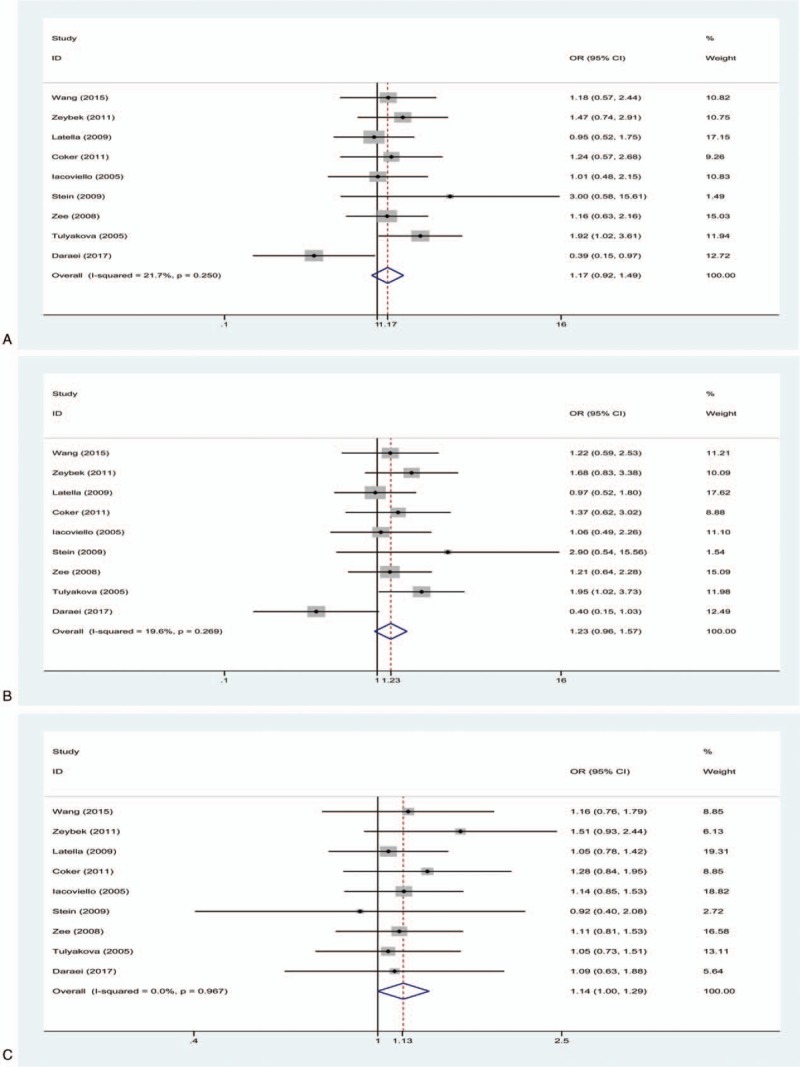
(A) Forest plot for the recessive model of IL-1β + 3954C/T in the overall comparison (TT vs TC + CC), fixed effect model; (B) Forest plot for the homozygote model in the overall comparison (TT vs CC), fixed effect model; (C) Forest plot for the heterozygote model of IL-1β + 3954C/T in the overall comparison (TC vs CC), fixed effect model. The size of the black square represents the weight of the study in the meta-analysis. The rhombus represents the combined OR. OR = odds ratio.