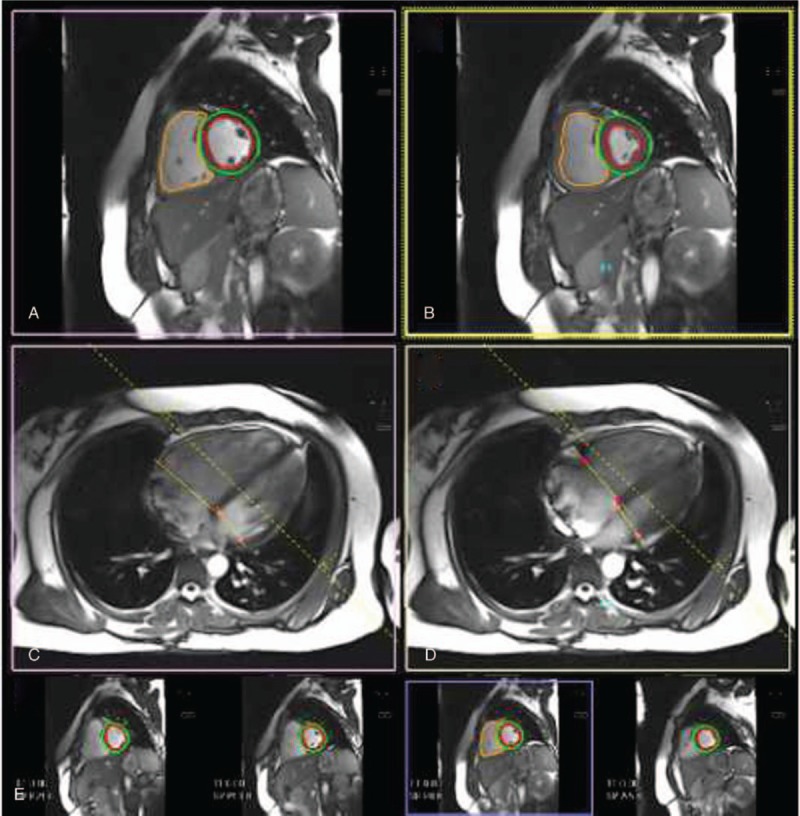
Figure 2.

Right ventricular (RV) and left ventricular (LV) chamber quantification. For RV volume quantification, the endocardial (orange) contours are delineated in diastole (A and C) and systole (B and D) in a stack of short-axis slices (E) that cover the whole RV. For LV chamber quantification, the endocardial (red) and epicardial (green) contours are delineated in diastole (A and C) and systole (B and D) in a stack of short axis slices (E) that cover the whole left ventricle with inclusion of the papillary muscles as part of the LV volume. (A, B) Corresponding mid-short axis in diastole (A) and systole (B). (C, D) The 4-chamber images in diastole (A) and systole (B) covering the RV and LV that enable best identification of the tricuspid valve plane and mitral valve plane, respectively.
