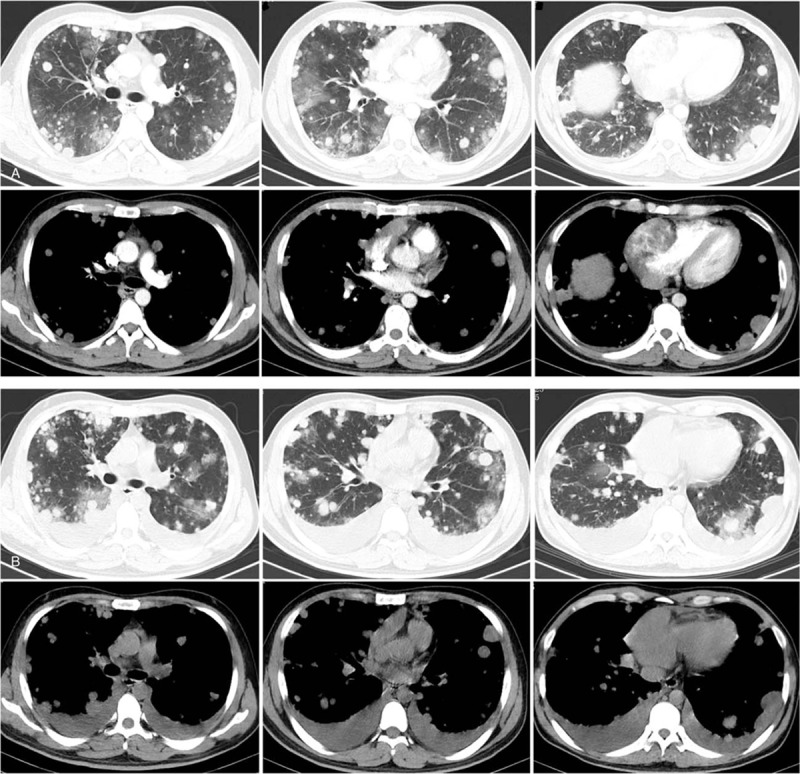
Figure 3.

Chest computed tomography (CT) scan. (A) a large mass (6 cm × 6.7 cm × 6.3 cm) in the right atrium (RA) and numerous pulmonary nodules in both lungs were seen by CT scan before therapy. (B) Some pulmonary nodules were enlarged and the bilateral pleural effusion increased after one cycle of chemotherapy. CT = computed tomography, RA = right atrium.
