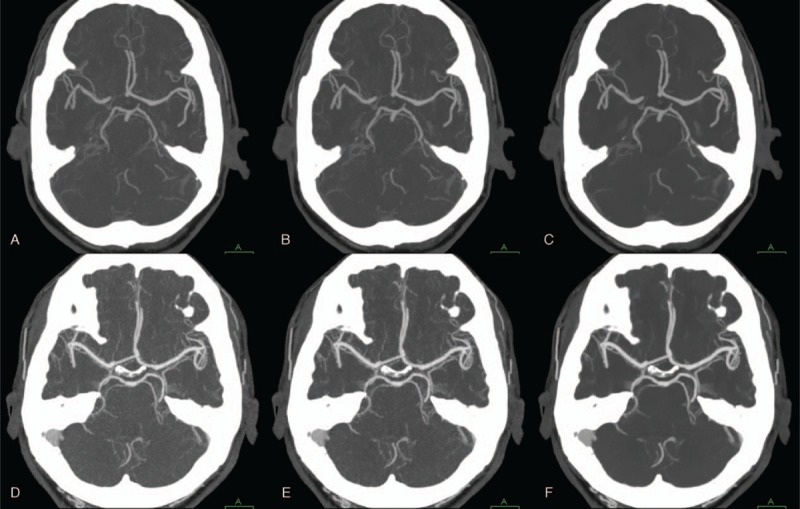
Figure 3.

Cerebral CTA performed at 100 kVp (A–C) and 80kVp (D–F) with 3 different reconstruction algorithms (A, D: FBP; B, E: hybrid IR; C, F: IMR). Vascular attenuation at 80 kVp is higher than that at 100 kVp. Maximum intensity projection images with IMR show better visualization of the circle of Willis at both 100 kVp and 80 kVp compared with FBP and hybrid IR. CTA = computed tomography angiography, FBP = filtered back projection, IMR = iterative model reconstruction, IR = iterative reconstruction.
