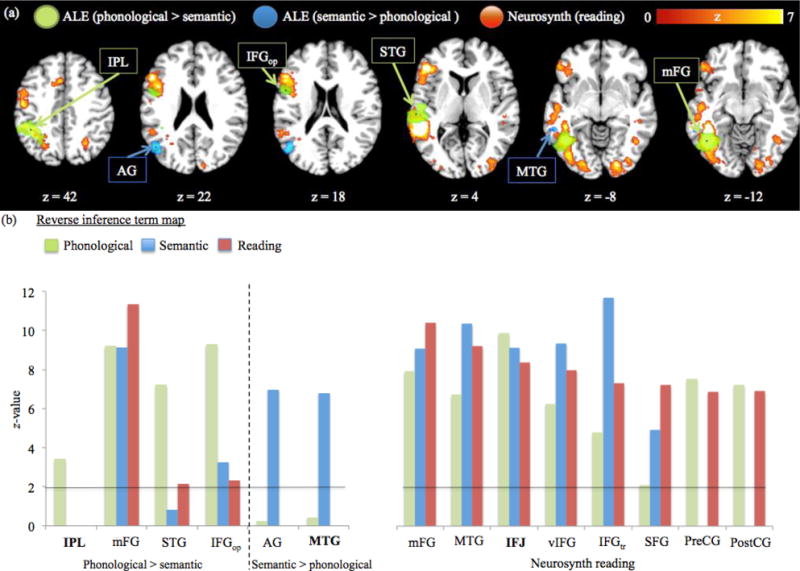
Figure 2.

Comparison of the three reading-related networks as determined by the ALE and Neurosynth map. (A) Activation comparison of the fractionated reading network regions for the six ALE phonological > semantic (green) and semantic > phonological (blue) clusters with the Neurosynth reverse inference map for the term reading (red). Spheres indicate each localized ALE cluster’s centroid voxel. Images were analyzed in MNI space and overlaid onto a 2×2×2 anatomical template provided by Brainmap.org (http://brainmap.org/). (B) Bar graph of the ALE phonological > semantic, semantic > phonological, and Neurosynth reading seed-voxels’ preferential bias towards functional terms. A 3 mm sphere was centered on each seed-voxel and placed onto the Neurosynth reverse inference maps for the terms phonological (green bars), semantic (blue bars), and reading (red bars). For each sphere, the average z-values were extracted and compared across the three reverse inference maps. Horizontal line indicates the significance threshold (z > 1.96). Regions in boldface font indicate functional connectivity with the cerebellum in subsequent analysis.
