Figure 3.

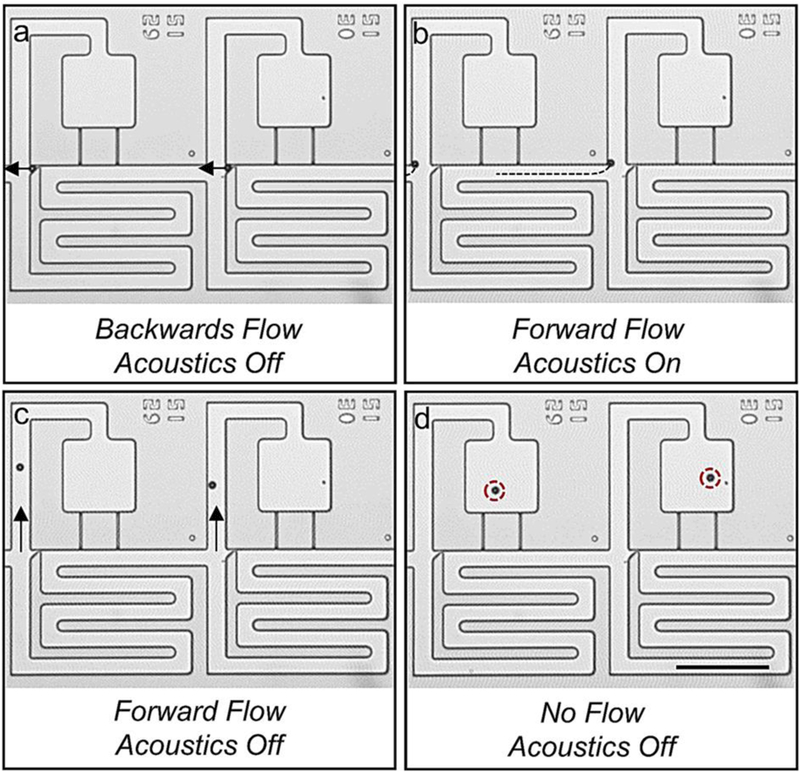
Image sequence detailing the acoustic switching mechanism. (a) Beads are captured in weirs using an oscillatory pressure profile. Once each site is occupied, beads are unloaded from weirs using backward flow. (b) Beads are slowly propelled towards the trifurcation junction (their paths are indicated by the dotted lines) using positive pressure and are acoustically trapped at the leading corner of the compartment region. (c) Beads are flowed into the compartment region. (d) Beads are loaded in the compartment region. Scale bar indicates 200 μm.
