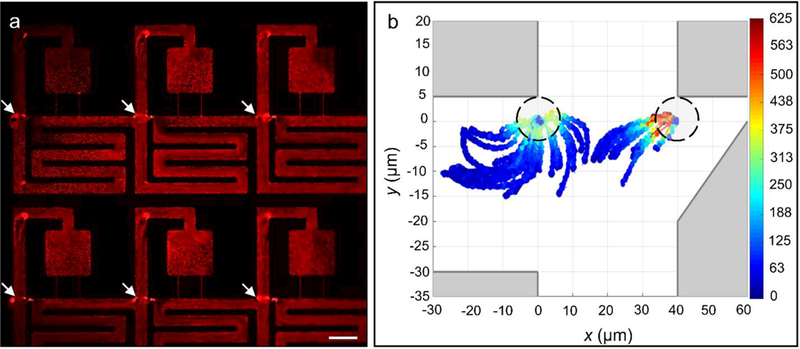
Figure 5.

(a) Red fluorescent image of nanoparticles under acoustic excitation at 1.4 MHz and 5 Vpp. (b) Normalized velocity magnitudes of 8.5 μm polystyrene beads approaching the entrance corner of the compartment region. Here, the dashed circles indicate the outline of the bead (or cell) at its final position. Scale bar indicates 100 μm.
