
Figure 8.
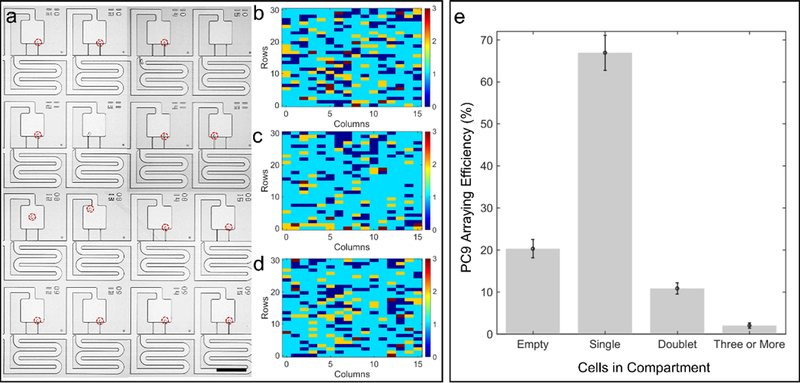
Arraying efficiency for PC9 cells in the compartment region of the trifurcation. (a) Representative image of arrayed cells. Number of cells captured in individual array sites for trial (b) one, (c) two, and (d) three. (e) Distribution of cells in n = 3 acoustofluidic chips. Scale bar indicates 200 μm.