
Figure 2. Nanogel anchoring to CD45 promotes prolonged cell surface retention.
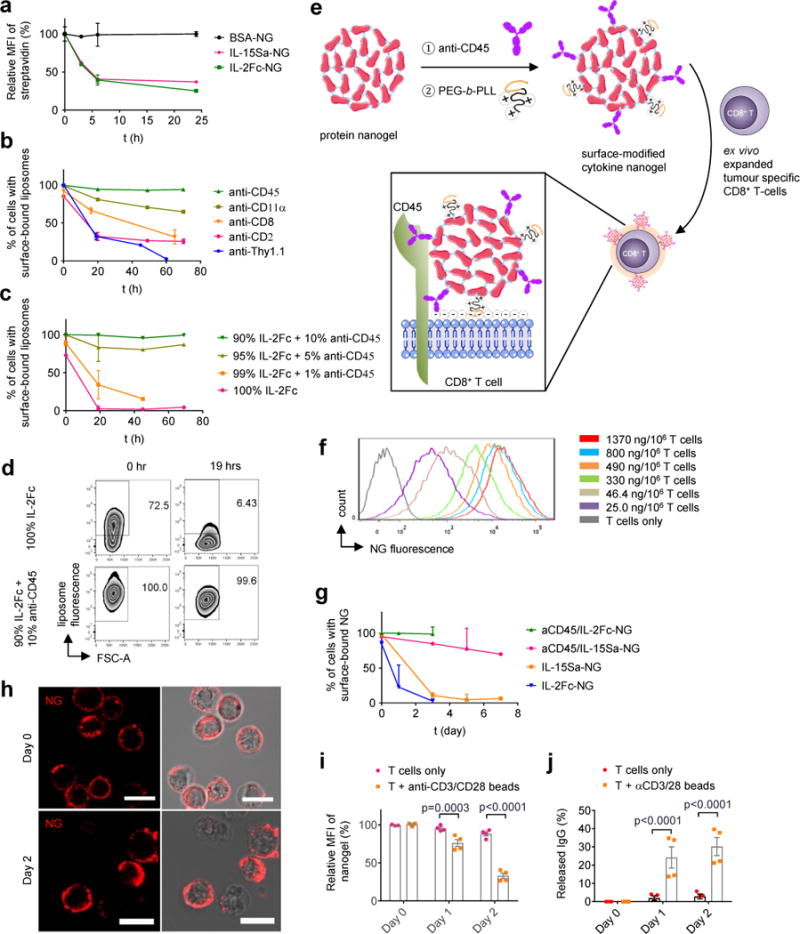
(a) Biotinylated protein NGs were covalently coupled to primed pmel-1 CD8+ T cells via a bis-NHS crosslinker, incubated in medium for indicated times then stained with fluorescent streptavidin (SAv) to detect cell surface-accessible particles and analysed by flow cytometry (n=3 independent samples). (b-d) Biotinylated liposomes functionalized with indicated monoclonal antibodies (b) or a mixture of anti-CD45 and IL-2Fc (c, d) were incubated with primed pmel-1 CD8+ T cells for indicated times, then stained with fluorescent SAv and analysed by flow cytometry to measure cell surface-accessible liposomes. Shown are mean % of cells with surface-accessible liposomes (b, c) and representative flow cytometry plots showing the frequencies of cells with surface-bound liposomes (d). n=3 independent samples in b-d. (e) Scheme for surface modification of cytokine-NGs to facilitate efficient and stable anchoring on T cell surfaces. (f) Primed pmel-1 CD8+ T cells were coupled with fluorescently-labelled aCD45/IL-15Sa NGs at the indicated cytokine levels, and NG levels on each cell were assessed by flow cytometry. (g) Primed pmel-s CD8+ T cells were conjugated with aCD45/cytokine- or cytokine only-biotinylated NGs, incubated for indicated times, then stained with SAv for analysis of cell-surface NGs by flow cytometry (n=3 independent samples). (h) Representative confocal microscopy images of primed pmel-1 CD8+ T cells with fluorescently labelled aCD45/IL-15Sa-NGs (red) on day 0 and day 2. Scale bar, 10 μm. (i-j) Release of fluorescently-labelled IgG from aCD45/IgG-NGs attached to primed pmel-1 CD8+ T cells incubated with or without anti-CD3/CD28 beads as assessed by flow cytometry (i) and HPLC analysis of culture supernatants (j) (n=4 independent samples). Data represent the mean ± s.e.m. and analysed by One-Way ANOVA and Tukey’s tests. All data are one representative of at least two independent experiments.