
Figure 4. IL-15Sa-NGs promote specific expansion of adoptively transferred T cells in tumors.
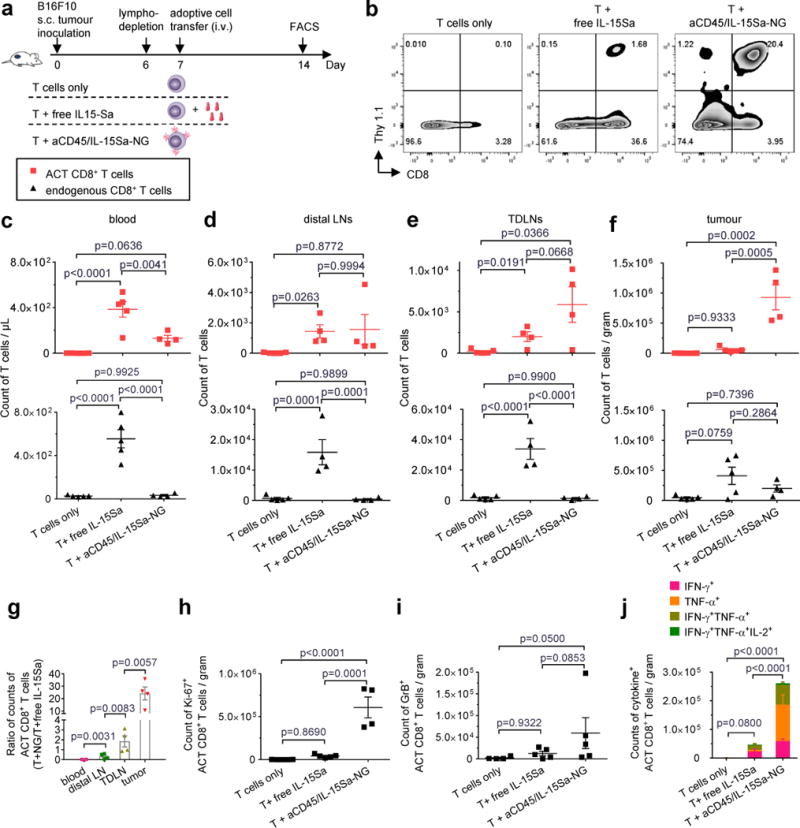
B16F10 tumor cells (0.5 × 10⁶) were injected s.c. in Thy1.2+ C57Bl/6 mice and allowed to establish for 6 days. Animals were then sublethally lymphodepleted by irradiation on day 6 and received i.v. adoptive transfer of 10×106 primed pmel-1 Thy1.1+CD8+ T cells on day 7. Treatment groups included T cells alone, T cells followed by a systemic injection of free IL-15Sa (40 μg), and T cells coupled with aCD45/IL-15Sa-NGs (40 μg). On day 14, mice were sacrificed and tissues were processed and analysed by flow cytometry (n=4 biologically independent animals). (a) Experimental timeline. (b) Representative flow cytometry plots showing the frequencies of tumor infiltrating Thy1.1+CD8+ T cells among all the lymphocytes. (c-f) Counts of adoptively transferred (ACT) Thy1.1+CD8+ T cells (red squares) and endogenous Thy1.1−CD8+ T cells (black triangles) in blood (c, normalized by volume), non-tumor draining lymph nodes (d, distal LNs), tumor draining lymph nodes (e, TDLNs) and tumors (f, normalized by weight). (g) Ratios of counts of ACT CD8+ T cells in the group of T + aCD45/IL-15Sa-NG to that of T + free IL-15Sa in different tissues. (h) Counts of Ki67+ ACT CD8+ T cells in tumors analysed by intracellular staining and flow cytometry. (i) Counts of GranzymeB+ ACT CD8+ T cells in tumors analysed by intracellular staining and flow cytometry on Day 10 (n=5 biologically independent animals). (j) Counts of polyfunctional ACT CD8+ T cells in tumors by intracellular cytokine staining. Data represent the mean ± s.e.m. and are analysed by One-Way ANOVA and Tukey’s tests. All data are one representative of at least two independent experiments.