
Figure 6. TCR signalling-responsive NG backpacks improve T cell therapies.
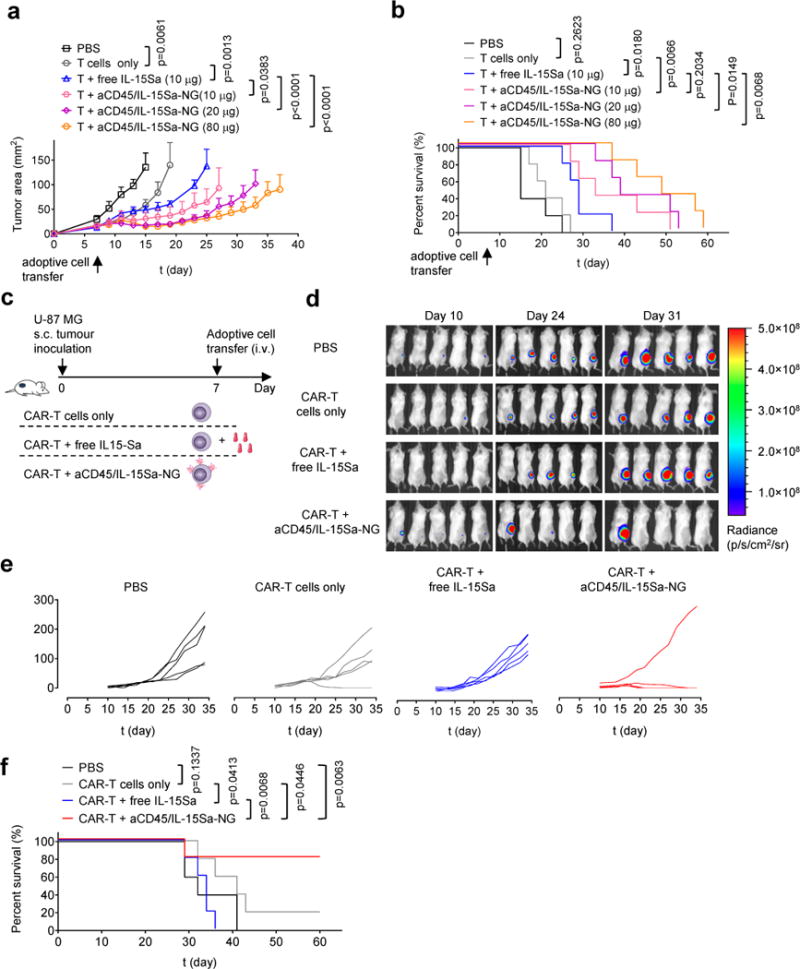
(a, b) B16F10 tumor cells (0.5 × 10⁶) were injected s.c. in Thy1.2+ C57Bl/6 mice (n=5 biologically independent animals) and allowed to establish for 6 days. Animals were then sublethally lymphodepleted by irradiation on day 6 and received i.v. adoptive transfer of 10 × 106 activated pmel-1 Thy1.1+CD8+ T cells on day 7. Animals received sham injections of PBS, T cells only, T cells with 10 μg i.v. injected free IL-15Sa, or aCD45/IL-15Sa-NG-backpacked T cells at indicated IL-15Sa doses. Shown are average tumor growth curves (a) and survival curves (b) of each treatment group. (c-f) Luciferase-expressing U-87 MG human glioblastoma cells (1.0 × 10⁶) were injected s.c. in NSG mice (n=5 biologically independent animals). Animals received i.v. adoptive transfer of human T cells (2.6 × 10⁶ total cells, 38% transduced with EGFR-targeting CAR (1.0 × 10⁶ CAR-T cells)) on day 7. Animals were treated with sham saline injections, CAR-T alone, CAR-T followed by 13.8 μg of free IL-15Sa, or CAR-T cells coupled with aCD45/IL-15Sa-NGs (13.8 μg). (d) In vivo bioluminescence imaging of luciferase-expressing U-87 MG tumors over time. (e-f) Individual tumor growth curves (e) and survival curves (f) of treatment groups are shown. Statistical analyses were performed using Two-Way ANOVA test for tumor growth data and Log-rank test for survival curves. Data represent the mean ± s.e.m. All data are one representative of at least two independent experiments.