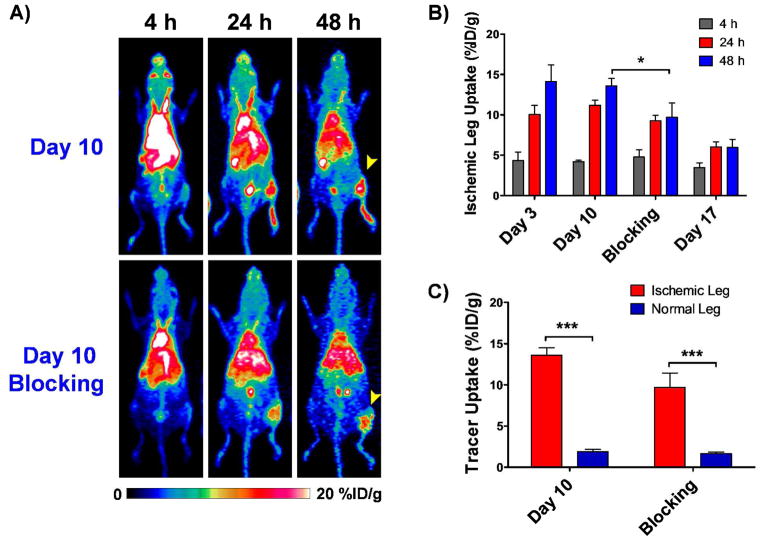
Figure 4.
Results from the Blocking Study carried out on a postoperative day 10. Arrowhead points to the ischemic leg. A) Serial maximum intensity projection (MIP) PET images at 4, 24 and 48h p.i on day 10 of mice with and without pre-injection of blocking dose. B) Tracer uptake, represented at %ID/g, in the ischemic leg at different time points on different postoperative days, including the blocking group on day 10. Error bars represent standard deviation. C) Comparative graph showing tracer uptake in the injured and non ischemic legs at 48h p.i. on postoperative day 10 with and without pre-injection of blocking dose.

