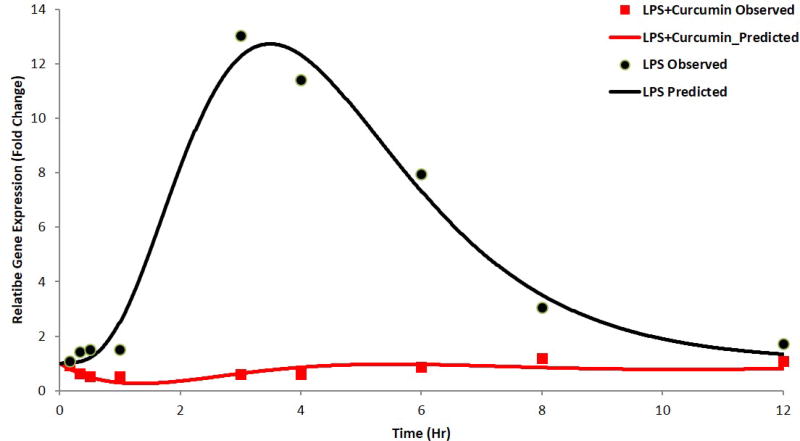
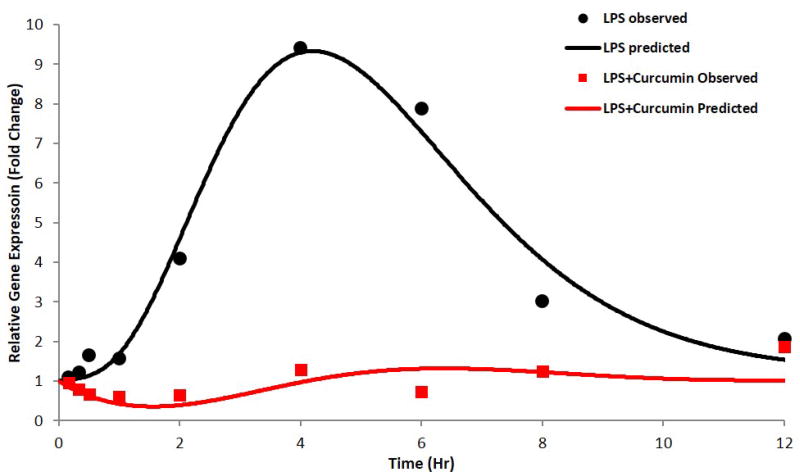
Figure 6.
a) TNF-α gene expression, b) IL-6 gene expression as described by the indirect response model with transit compartments; the circles and squares represent mean of observed data and the solid lines represent the data predicted by the model for LPS-only and curcumin with LPS groups, respectively.


