FIG 1.
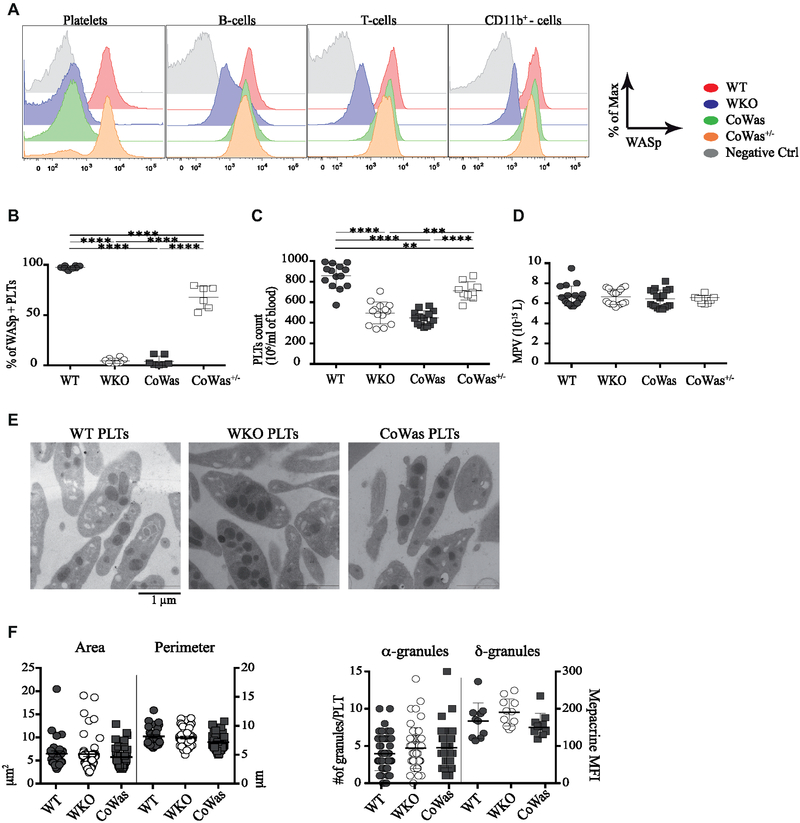
Characterization of CoWas mice. A, WASp expression was evaluated in different cell types in peripheral blood of6-week-old WT, WKO, CoWas, and CoWas+/− mice. B, Graph shows the percentage of WASp+ platelets in different mouse models at 8 to 12 weeks of age. C and D, Hemogram analysis of WT, WKO, CoWas, and CoWas+/− mice shows platelet counts (Fig 1, C) and mean platelet volume (MPV; Fig 1, D). E, Representative TEM images of platelets isolated from peripheral blood of WT, WKO, and CoWas mice. F, The perimeter and area were measured by using ImageJ Software (left panel), as was the number of α-granules (right panel). Dense granules were evaluated by using mepacrine and analyzed by using flow cytometry (right panel). In Fig 1, B-D, each dot represents a different mouse from 2 independent experiments; in Fig 1, F, each dot represents the analysis of single platelets within different TEM images. All the graphs report means ± SDs, and statistical analysis was performed with 1-way ANOVA and the Bonferroni postcorrection test. *P < .05, **P < .005, ***P < .001, and ****P < .0001. PLT, Platelets.

