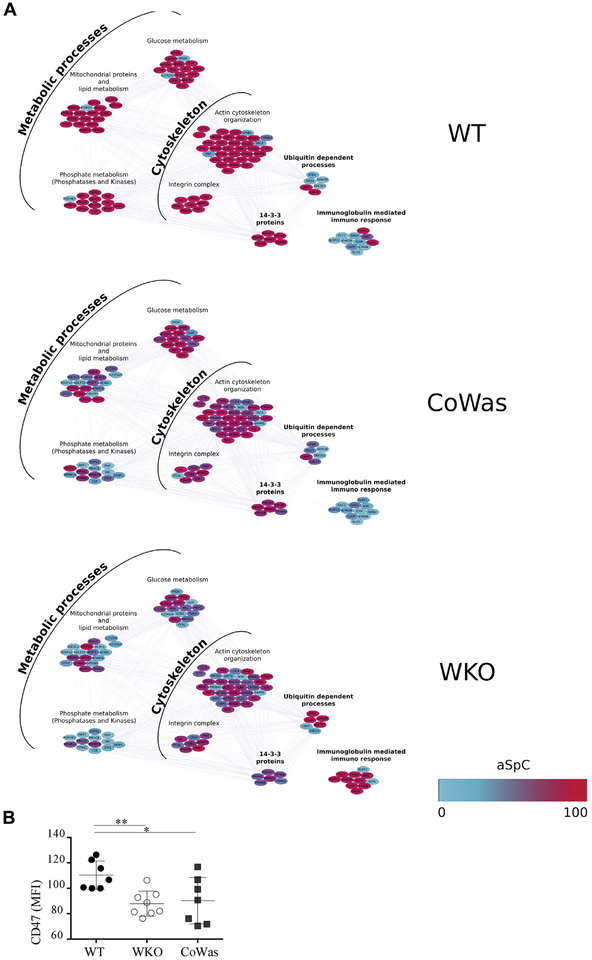
FIG 5.
Different proteomic profile between WT and Was−/− platelets. A, Focus on the main biological processes identified during proteomic analysis. Proposed clusters were selected by using the BINGO Cytoscape plugin (P ≤ .05), and color gradients correspond to the normalized average spectral count (aSpC; 0–100), where red indicates upregulated proteins, blue indicates downregulated proteins, and the shade between red and blue indicate intermediate level of expression. B, The graph shows the CD47 MFI on the CD61+ platelet subpopulation. Statistical analysis has been performed with the unpaired t test. Each dot represents a mouse. *P < .05 and **P < .005.

