FIG 6.
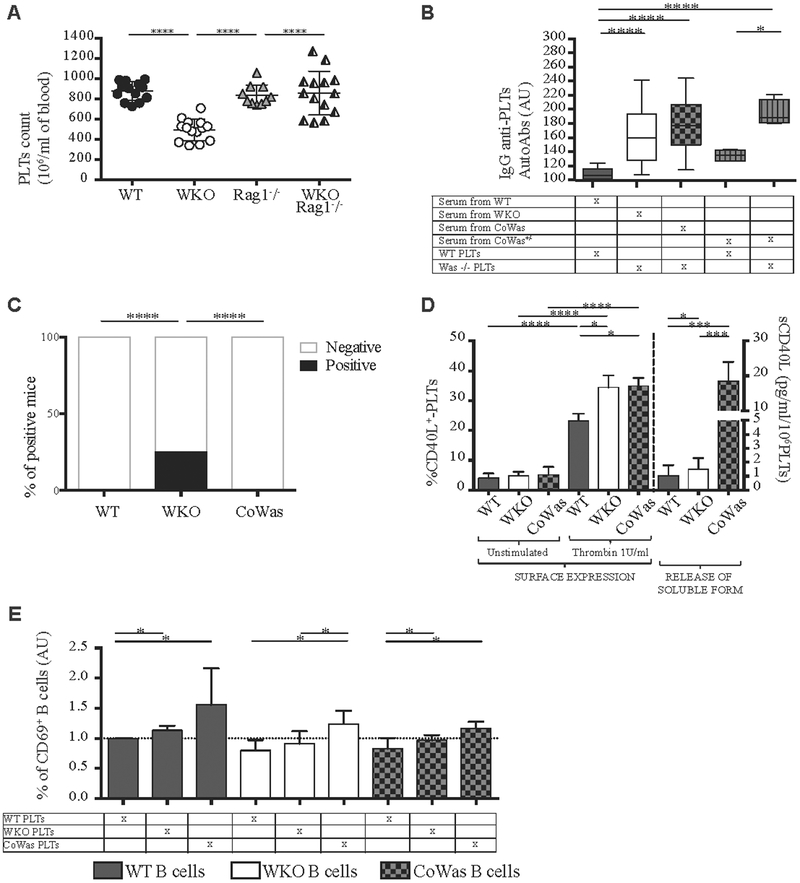
Interaction between platelets (PLTs) and B cells mediated by CD40L. A, Platelet counts from age-matched WT, WKO, Rag1−/−, and WKO- Rag1−/− mice are shown. B, Evaluation of IgG antiplatelet autoantibodies. ELISA plates were coated with total protein lysates from WT or Was−/− platelets and incubated with sera according to the grid presented (n = 23). C, The graph represents the percentage of mice positive for the anti-double-stranded DNA autoantibodies. D, Percentage of CD40L+ platelets was evaluated by using flow cytometry before (n = 10) and after (n = 12) stimulation with thrombin (1 U/mL; left); sCD40L was measured in PPP from unwashed platelets isolated from WT (n = 16), WKO (n = 16), and CoWas (n = 5) mice (right). E, Resting B cells (CD43− cells) isolated from the spleens of WT, WKO, and CoWas mice were kept in culture for 72 hours with PPP and analyzed by using flow cytometry for CD69 expression as an activation marker. In Fig 6, A, each dot represents a different mouse, and means ± SDs are reported. In Fig 6, B, D, and E, the mean ± SD reported is the result of 2 (Fig 6, B) and 4 (Fig 6, D) independent experiments. Statistical analysis was performed with 1-way ANOVA and the Bonferroni postcorrection test (Fig 6, A, B, and D, left panel). In Fig 6, D, sCD40L levels (rightpanel) are analyzed with the Mann-Whitney test, as well as Fig 6, D. Fig 6, C, has been analyzed statistically with the χ2test. *P <.05, **P < .005, ***P < .001, and ****P < .0001.

