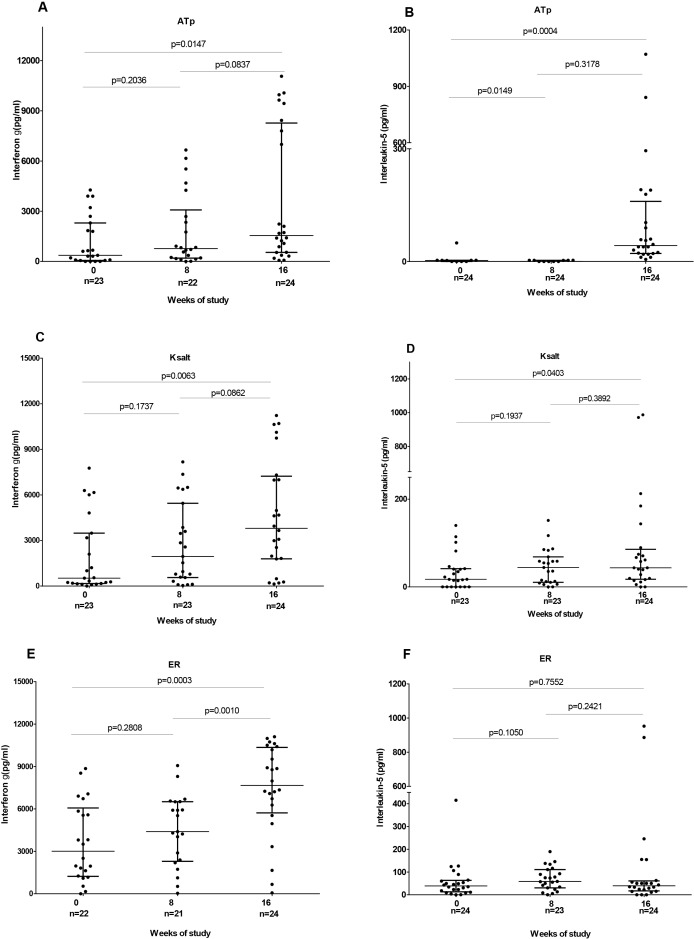
Figure 5. IFN-γ and IL-5 responses before (week 0), at completion of antibiotic treatment (week 8) and 8 weeks after antibiotic completion (week 16) to polyketide synthase antigens.
IFN-γ responses are shown for ATp (A), Ksalt (C) and ER (E) while IL-5 responses are shown for ATp (B), Ksalt (D) and ER (E). Comparison between groups was done with Mann-Whitney test. Each dot represents the response of one study participant. The horizontal lines represent the median and Interquartile range for each group.

