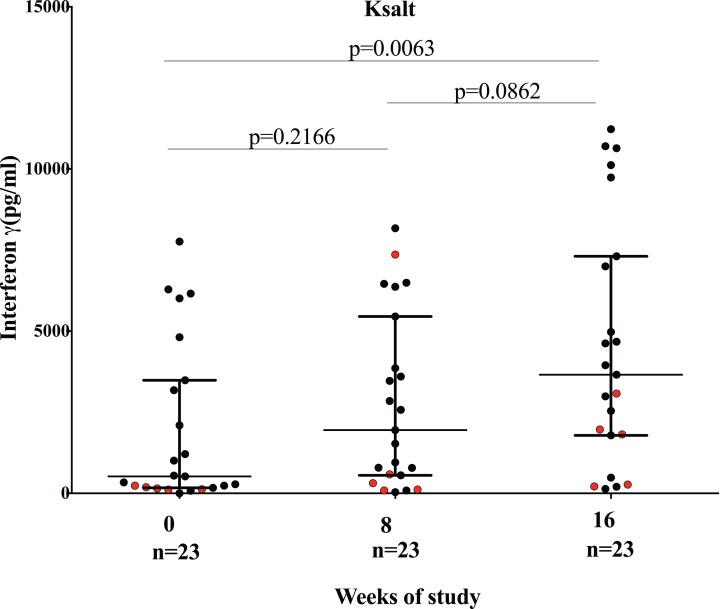
Figure 6. Comparison of IFN-γ responses before (week 0), at completion (week 8) of antibiotics and 8 weeks after antibiotic completion (week 16) to plasmid DNA encoding mycolactone PKS antigens Ksalt.
Red dots represent IFN-γ responses of patients with detection of viable organisms at week 8. Each dot represent response for one study participant. The horizontal lines represent the median and Interquartile range for each group.

