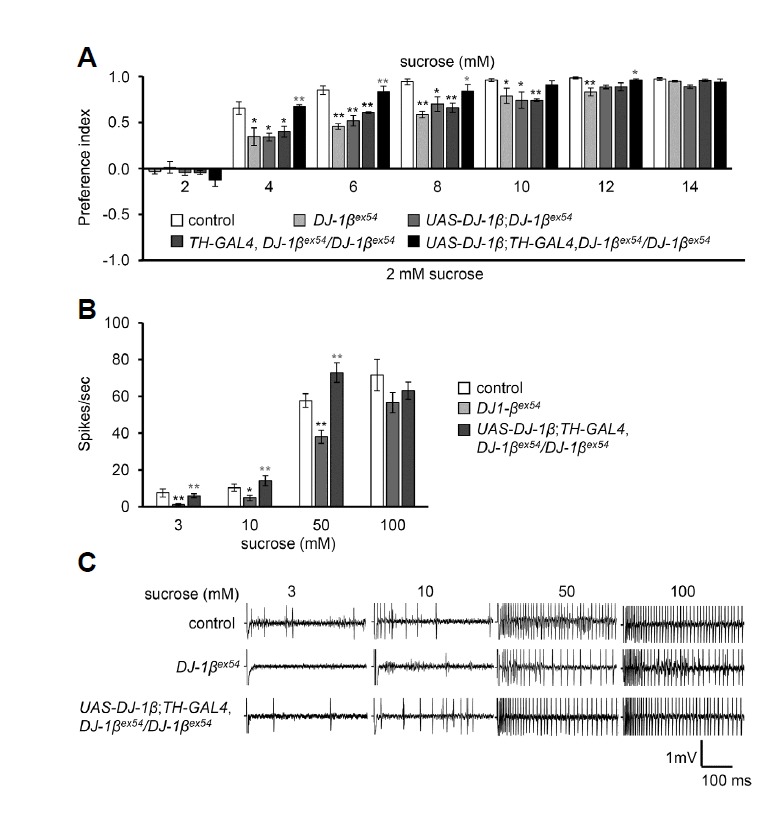
Fig. 1. Sugar sensitivity in DJ-1βex54.

(A) Binary choice feeding assay was performed for different concentrations of sucrose versus 2 mM sucrose with control, DJ-1βex54, and rescue flies. n = 4–6. (B) Tip recordings from L6 sensillum with 3 mM, 10 mM, 50 mM and 100 mM sucrose from control, DJ-1βex54, and rescue flies. n = 10. (C) Representative sample traces of (B). The error bars represent SEMs. The asterisks indicate significant differences when compared to control (black asterisk) and mutant parent lines (gray asterisk) (*P < 0.05, **P < 0.01) using single factor ANOVA with Scheffe’s analysis as a post hoc test to compare the two sets of data.
