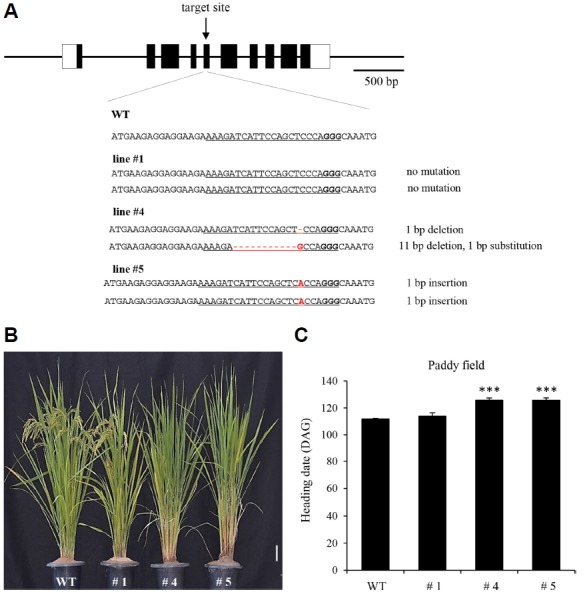
Fig. 2. Generation of additional hdt701 alleles by CRISPR/Cas9 method.

(A) Schematic diagram of HDT701 structure and sequence alignment of sgRNA target region displaying altered bases in mutant lines. The target sequence is underlined. Altered DNA sequences are indicated in red. (B) Phenotypes of hdt701 KO lines at heading stage. Scale bar, 10 cm. (C) Days to heading for WT, and KO Lines #1, 4, and 5 under natural paddy field conditions. Days to heading was scored when first panicle bolted. Error bars indicate standard deviations; n = 10. Levels of significant difference are indicated by ** (P < 0.01) and *** (P < 0.005).
